Ever feel like you’re flying blind with Shopify’s standard reports? You’re not alone. While Shopify’s default dashboards provide a decent overview of your store’s performance, they often leave you hungry for deeper insights that match your specific business questions. That’s where custom reports come in—they’re the secret weapon of data-driven store owners who want to cut through the noise and focus on metrics that actually matter to their business.
Custom reporting in Shopify isn’t just for data analysts or tech experts. It’s for any store owner who’s tired of making decisions based on incomplete information. With the right approach, you can transform raw data into actionable insights that drive real growth—without needing a degree in data science.
In this comprehensive guide, you’ll discover how to harness the full power of Shopify’s custom reporting tools. You’ll learn how to create reports that answer your unique business questions, automate your data analysis, and overcome common limitations. By the end, you’ll have the knowledge to build a reporting system that gives you a genuine competitive advantage.
Understanding Shopify Custom Reports: Fundamentals and Benefits
What Are Custom Reports in Shopify
Custom reports in Shopify are exactly what they sound like—reports you can tailor to your specific needs. But what makes them truly powerful is their flexibility. These aren’t just tweaked versions of standard reports; they’re completely personalized views of your data that align with your unique business goals.
At their core, Shopify custom reports let you do three key things: modify existing reports to better suit your needs, create entirely new reports from scratch, and select precisely which metrics you want to track. It’s like having a personal data analyst who knows exactly what information you need to see.
The availability of custom reporting features varies across Shopify plans. Basic exploration capabilities are available to merchants on all plans, but you’ll need to be on Advanced or Plus plans to access the full suite of advanced reporting features. If you’re on a lower-tier plan, you’ll still have options, but they may be more limited.
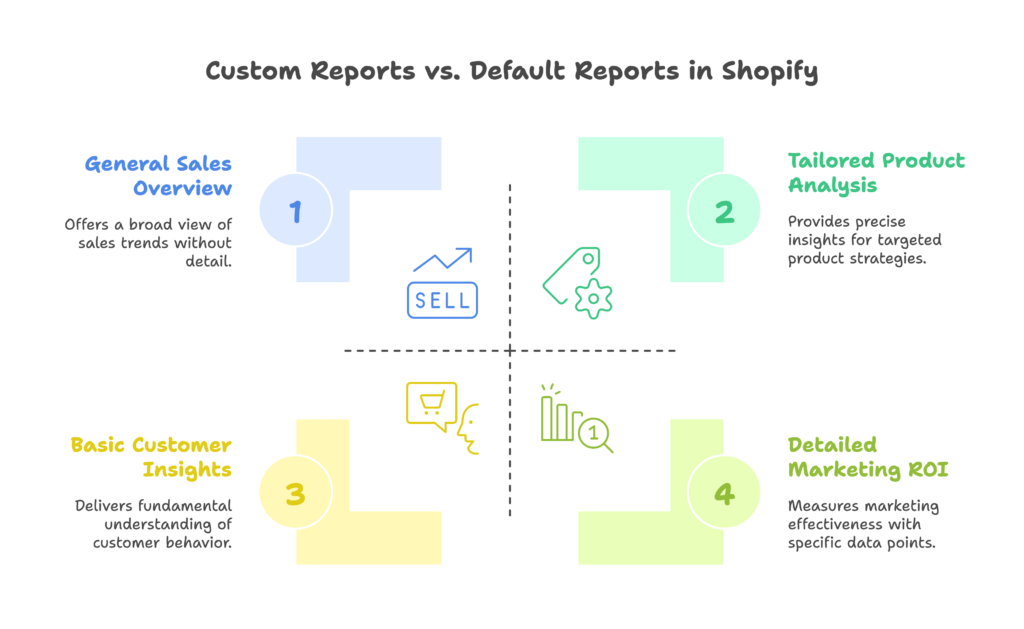
When compared to Shopify’s default reporting, custom reports address several critical limitations. While default reports provide a good general overview, they often lack the specificity needed for nuanced business decisions. Custom reports bridge this gap by allowing you to focus on exactly what matters to your store—whether that’s tracking the performance of a specific product category, analyzing customer behavior in more detail, or measuring the ROI of your marketing efforts with greater precision.
Benefits of Custom Reporting for Shopify Store Owners
The ability to create custom reports isn’t just a nice-to-have feature—it’s a powerful tool that can transform how you run your business. Here’s why it matters:
First, custom reports enable truly data-driven decision making. Instead of relying on gut feeling or general trends, you can identify patterns specific to your business. Want to know which products perform best after a social media promotion? Or how weather affects your sales of seasonal items? Custom reports let you answer these questions with precision, helping you make decisions based on evidence rather than assumptions.
Custom reporting also enhances your business intelligence in ways that standard reports can’t match. You gain deeper insights into customer behavior—like identifying which products are frequently purchased together, or which customer segments have the highest lifetime value. This level of detail helps you make smarter decisions about inventory management, marketing strategies, and product development.
Perhaps most importantly, custom reports save you time and resources. Instead of sifting through irrelevant data or juggling multiple analytics tools, you can create streamlined reports that show exactly what you need to know. This efficiency means you can spot opportunities and respond to market changes faster than competitors who rely on more generic analytics.
Getting Started with Custom Reports in Shopify
Accessing the Custom Reports Feature
Before you can create custom reports, you need to know where to find the feature in Shopify. The navigation path varies slightly depending on whether you’re using desktop or mobile.
On desktop, head to Analytics > Reports, then look for either “Create custom report” or “New exploration” options. If you’re using the iOS Shopify app, navigate to Analytics > Reports and tap the “+” icon. Android users will follow a similar path: Shopify app > Analytics > Reports > “+”.
Once you’re there, you’ll encounter the user interface, which includes three main components: the ShopifyQL query editor (where you can write custom queries if you’re comfortable with that), the configuration panel (where you select metrics and dimensions), and visualization options (for choosing how your data is displayed).
It’s worth noting that not all users have the same level of access to reporting features. To create custom reports, you’ll need admin access or specific staff permissions. If you’re working with a team, consider how reporting responsibilities should be distributed and set up the appropriate permissions accordingly.
Two Approaches to Creating Custom Reports
When it comes to creating custom reports in Shopify, you have two main approaches: modifying existing reports or building from scratch.
The first approach—modifying existing default reports—is often the easiest place to start, especially if you’re new to custom reporting. Simply select a default report that’s close to what you need, then customize the metrics, dimensions, and filters to better align with your specific questions. Once you’ve made your modifications, save the report with a new name to preserve both the original and your customized version.
The second approach—building from an empty exploration—gives you complete freedom but requires a bit more expertise. You start with a blank canvas and add at least one metric (a requirement for any report). From there, you build your report structure step by step, adding dimensions, filters, and visualizations as needed. This approach is ideal when none of the default reports come close to answering your specific business questions.
For those who want a middle ground, Shopify also offers templates that can serve as starting points for custom reports. These templates save time while still allowing for customization. Just be aware that on some plans, you may be limited to five templates, so choose wisely.
Key Components of Effective Custom Reports
Selecting Appropriate Metrics and Dimensions
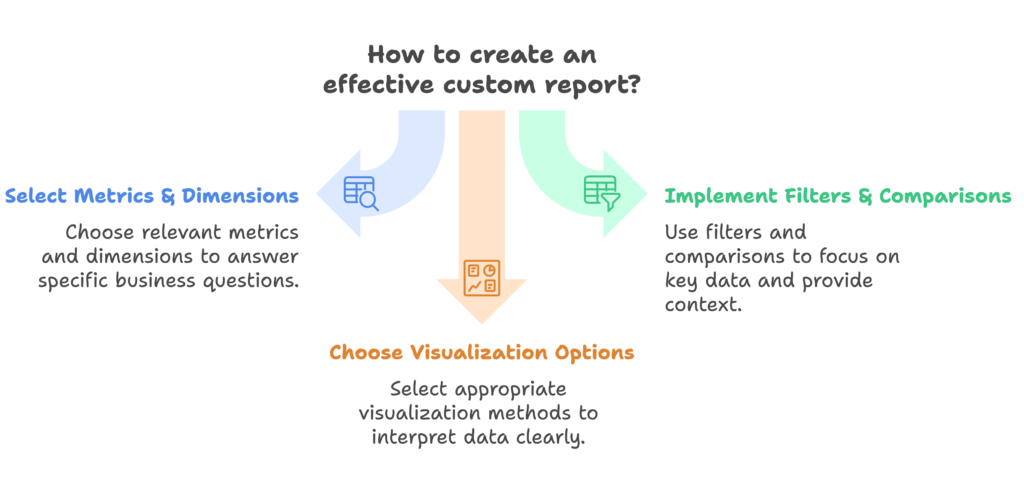
The heart of any effective custom report lies in selecting the right metrics and dimensions. Metrics are the quantitative values you want to measure (like revenue or order count), while dimensions are the attributes you use to segment your data (like time periods or product categories).
Shopify offers a wide range of data points you can include in your reports. Sales metrics cover everything from total revenue and order count to average order value and discount usage. Customer metrics help you understand acquisition, retention, and lifetime value. Product metrics show you performance, inventory levels, and margins for different items in your store.
The real power comes from combining these metrics in meaningful ways. For example, pairing customer acquisition cost with lifetime value gives you a clear picture of your marketing efficiency. Creating calculated metrics—like profit margin percentages or revenue per visitor—can provide even deeper insights that aren’t available in standard reports.
Dimensions are equally important as they determine how your data is segmented. Time-based dimensions let you analyze trends by day, week, or month. Customer segments help you compare behavior between new and returning customers or across different geographic locations. Product categories and collections enable you to see which types of products drive your business performance.
The key is to select combinations of metrics and dimensions that answer specific business questions. Don’t try to include everything in a single report—focus on what matters most for the decision at hand.
Implementing Effective Filters and Comparisons
Filters and comparisons turn good reports into great ones by helping you focus on exactly what matters and providing crucial context for your data.
Shopify offers several types of filters you can apply to your custom reports. Simple filters let you segment data based on basic criteria, like showing sales only for a specific product category. Nested filter conditions using OR/AND logic enable more complex filtering—for instance, showing sales for either new customers OR customers from a specific region. Date range filters are particularly useful for temporal analysis, allowing you to zoom in on specific time periods.
Comparison features add another layer of insight by putting your data in context. Period-over-period comparisons show how performance has changed over time—like this month versus last month, or this year versus last year. Segment comparisons help you understand how different parts of your business stack up against each other. Performance against targets or benchmarks helps you gauge progress toward your goals.
For more sophisticated analysis, advanced filtering techniques come into play. Excluding outliers (like unusually large orders that might skew your data) can give you a more accurate picture of typical performance. Focusing on specific customer segments helps you understand the behavior of your most valuable customers. Isolating high-impact products or categories lets you zoom in on the parts of your catalog that drive most of your business.
Visualization Options for Data Interpretation
Even the best data can be hard to interpret without the right visualization. Shopify offers several chart types to help you make sense of your custom reports.
Line charts are ideal for trend analysis, showing how metrics change over time. They’re perfect for spotting seasonal patterns or tracking growth trajectories. Bar charts excel at comparative analysis, making it easy to see which categories, products, or time periods perform best relative to each other. Tables provide the most detailed view of your data, showing exact numbers for deeper analysis.
Choosing the right visualization depends on what story you want your data to tell. If you’re tracking performance over time, a line chart typically works best. For comparing different segments, a bar chart might be more effective. If you need to see precise values for multiple metrics, a table could be the way to go.
You can enhance your visualizations further with features like conditional formatting, which highlights values that meet certain criteria (like profits above a specific threshold). Color coding improves readability by making patterns more visually apparent. Adding context through labels and annotations helps ensure that anyone looking at the report understands what they’re seeing.
Advanced Custom Reporting Techniques
Using ShopifyQL for Complex Queries
For those ready to take their custom reporting to the next level, ShopifyQL (Shopify Query Language) offers powerful capabilities. This specialized query language allows you to create complex, customized reports that go beyond what’s possible with the standard interface.
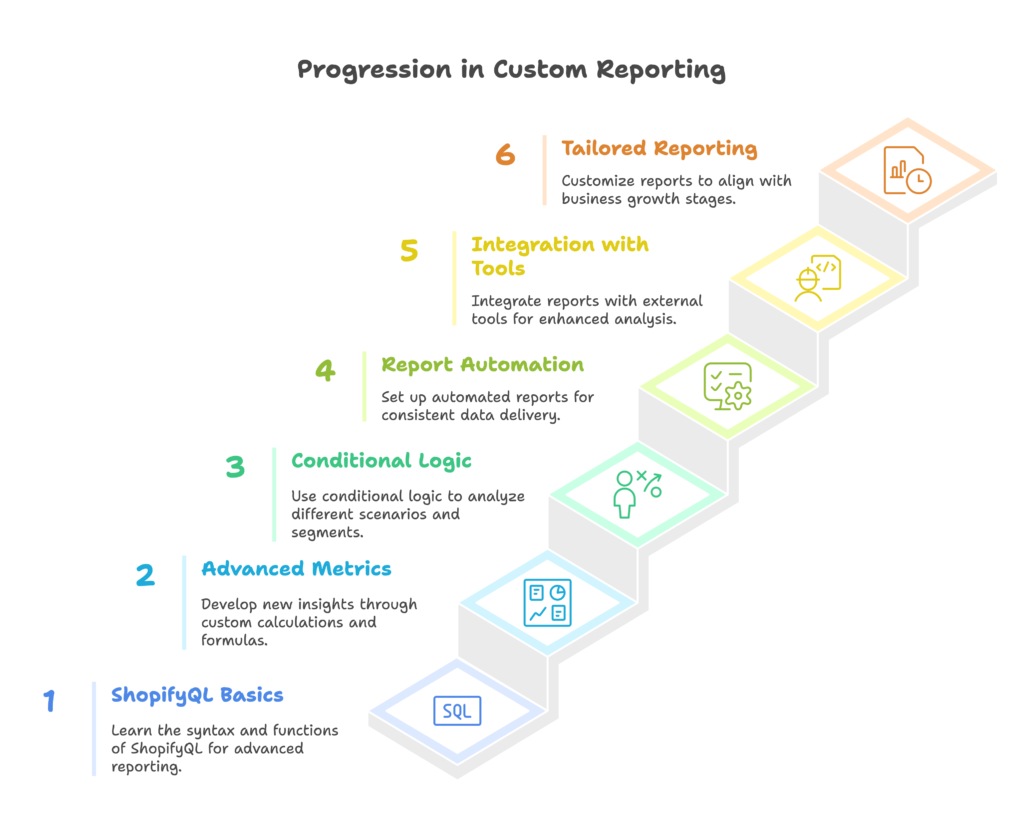
The basics of ShopifyQL involve understanding its syntax, which follows a structure similar to SQL but designed specifically for Shopify data. You’ll work with functions like SUM, AVG, and COUNT, operators like AND, OR, and NOT, and learn techniques to optimize your queries for better performance. While there’s definitely a learning curve, the payoff in terms of reporting flexibility is substantial.
With ShopifyQL, you can create advanced metrics that aren’t available through the standard interface. Custom calculations and formulas let you derive new insights from your existing data. Conditional logic in queries enables you to analyze different scenarios or customer segments. Various aggregation methods help you summarize data in meaningful ways.
Some practical examples of what you can do with ShopifyQL include cohort analysis (tracking how customer groups behave over time), detailed customer segmentation (beyond basic new vs. returning distinctions), and product performance analysis that accounts for factors like seasonality, promotions, or inventory levels.
While ShopifyQL requires more technical knowledge than the standard reporting interface, it’s worth investing time to learn if you’re serious about data-driven decision making for your store.
Report Automation and Scheduling
Creating insightful reports is valuable, but the real magic happens when you automate the process. Shopify’s automation features ensure you always have fresh data without manual effort.
Setting up automated reports involves configuring several elements. You’ll need to choose scheduling options and frequency settings—whether you want reports daily, weekly, monthly, or on specific days. Email notification configuration determines who receives the reports and when. You can also select the report format, such as PDF or CSV, depending on how the data will be used.
Distribution and sharing capabilities make it easy to get reports into the hands of decision-makers. You can share reports with team members directly through Shopify, control access permissions to ensure sensitive data is only seen by authorized personnel, and establish collaborative analysis workflows so multiple people can contribute insights.
For more advanced needs, integration with external tools extends your reporting capabilities. You can export reports to spreadsheet programs for additional analysis, set up Google Sheets integration with automatic updates to maintain live dashboards, or connect with business intelligence platforms for more sophisticated visualization and analysis.
Automation not only saves time but also ensures consistency in your reporting practices—a crucial element for making valid comparisons over time.
Custom Report Use Cases for Different Business Stages
The reports you need change dramatically as your business evolves. What works for a new store won’t necessarily serve you well as you scale.
During the startup phase, focus on reports that help you validate your business model. Customer acquisition cost analysis shows whether you’re acquiring customers profitably. Product-market fit indicators help you understand if your offering resonates with customers. Cash flow and runway monitoring ensure you’re maintaining the financial health needed to grow.
As you enter the growth phase, shift your attention to optimization and expansion. Marketing channel effectiveness reports help you double down on what’s working and cut what isn’t. Customer retention metrics reveal whether you’re building a sustainable business. Inventory optimization indicators prevent stockouts and overstock situations that can drain capital.
When you reach the scaling phase, your reporting needs become more sophisticated. Regional performance comparison helps you identify expansion opportunities. Advanced customer lifetime value analysis guides customer acquisition and retention strategies. Product line expansion opportunity identification helps you grow your catalog strategically.
By tailoring your reporting approach to your current business stage, you ensure you’re focusing on the metrics that matter most right now—while still preparing for future growth.
Overcoming Limitations and Extending Capabilities
Understanding Shopify Custom Report Limitations
While Shopify’s custom reporting tools are powerful, they do have limitations you should be aware of—and strategies for working around them.
Plan-specific restrictions are the first consideration. Feature availability varies across different Shopify plans, with more advanced capabilities reserved for higher-tier plans. There are also template and field limitations to consider—some plans restrict you to five templates and don’t allow custom formula fields. Data retention policies determine how far back your historical data goes, which can affect long-term trend analysis.
Technical constraints present another set of challenges. Query complexity limitations mean very intricate reports might not be possible within Shopify itself. Data processing time can increase with large datasets or complex queries. Visualization constraints might limit how you can present certain types of data.
Fortunately, there are workarounds for many common limitations. Breaking complex reports into multiple simpler reports can overcome query limitations. Using calculated fields effectively can compensate for formula limitations. When necessary, supplementing with external tools can fill capability gaps that Shopify doesn’t address.
Understanding these limitations upfront helps you develop realistic expectations and effective strategies for getting the insights you need, even when working within constraints.
Third-Party Apps for Enhanced Reporting
When Shopify’s native reporting capabilities don’t quite meet your needs, third-party apps can fill the gaps. The Shopify App Store offers a robust ecosystem of reporting solutions designed to address specific analytics challenges.
These reporting apps fall into several categories. Some focus on financial analytics, providing deeper insights into profitability and cash flow. Others specialize in marketing performance, customer behavior, or inventory management. Most integrate directly with your Shopify store, pulling data automatically and presenting it in customized dashboards or reports.
Among the popular options, Mipler: Advanced Reports stands out for its custom calculations and formula capabilities. Report Toaster excels at specialized reporting needs like bundle performance or customer cohort analysis. BeProfit focuses specifically on financial reporting, helping you understand true profitability after accounting for all costs.
When selecting a reporting app, consider three key factors: your specific reporting needs (what questions are you trying to answer?), your budget (paid apps typically offer more features but add to your monthly costs), and integration requirements (how will the app work with your existing tools and workflows?).
While third-party apps add capabilities, they also introduce complexity and additional costs. Evaluate carefully whether the enhanced reporting justifies these tradeoffs for your business.
Custom Development Options
For stores with advanced reporting needs that can’t be met by either Shopify’s native tools or third-party apps, custom development offers the ultimate flexibility—though at a higher cost and complexity.
The Shopify API provides the foundation for custom reporting solutions. Available endpoints allow you to extract various types of data from your store, from orders and customers to products and inventory. When working with the API, you’ll need to consider authentication and security to protect sensitive data, as well as rate limiting and performance optimization to ensure your solution works efficiently.
For more sophisticated needs, data warehousing approaches provide even greater flexibility. This involves exporting Shopify data to external databases, setting up ETL (Extract, Transform, Load) processes to prepare the data for analysis, and building custom dashboards with business intelligence tools like Tableau, Power BI, or even custom web applications.
Custom development makes sense in specific scenarios: when you have complex reporting requirements beyond what apps can provide, when you need to integrate Shopify data with proprietary systems, or when the business value of advanced analytics justifies the development investment. Always conduct a thorough cost-benefit analysis before going down this path, as custom solutions require ongoing maintenance and updates.
Best Practices for Effective Custom Reporting
Report Design Principles
How you design your reports significantly impacts their usefulness. Effective reports don’t just contain the right data—they present it in a way that drives understanding and action.
Clarity and simplicity should be your guiding principles. Focus on key metrics that drive decisions rather than including every possible data point. Avoid information overload by limiting each report to answering a specific business question. Use consistent formatting and terminology to make reports easy to scan and understand.
The best reports yield actionable insights. Design them to answer specific business questions, not just display data. Include context and benchmarks so viewers understand whether numbers represent good or poor performance. Highlight exceptions and opportunities that require attention or action—like unusual sales drops or untapped growth areas.
Accessibility considerations ensure your reports serve all stakeholders. Make reports understandable to people without deep analytics knowledge by including clear labels and definitions. Provide explanations for complex metrics so everyone shares the same understanding. Ensure mobile-friendly designs for team members who may review reports on the go.
Remember, a well-designed report should tell a story at a glance while allowing deeper investigation when needed. The goal isn’t just to share data but to facilitate better business decisions.
Data Quality and Integrity
Even the most beautifully designed report is worthless if the underlying data isn’t accurate. Establishing robust data quality and integrity practices ensures your reports provide a reliable foundation for decisions.
Start by ensuring accurate data collection. This means setting up proper tracking for all relevant business activities, from sales and refunds to marketing campaigns and customer interactions. Regularly audit your data sources to confirm they’re capturing information correctly. Address any tracking gaps promptly to maintain comprehensive coverage.
Learn to handle data anomalies effectively. Identify and investigate outliers that might skew your analysis—like a single unusually large order that makes an otherwise poor day look profitable. Account for seasonality and special events (like holiday sales or promotions) when interpreting trends. Document data limitations so report users understand potential blind spots.
Establish data governance practices to maintain consistency across your reporting. Create clear definitions for key metrics so everyone in your organization shares the same understanding. Manage access to sensitive information to protect customer privacy and business confidentiality. Create thorough documentation for custom reports so others can understand how they’re constructed and what they measure.
By prioritizing data quality and integrity, you build trust in your reporting system and ensure decisions are based on accurate information rather than misleading figures.
Reporting Workflows and Cadences
Reports are most valuable when embedded in consistent workflows that turn insights into action. Establishing effective routines around your reporting creates a culture of data-driven decision making.
Start by establishing regular review processes. Daily reviews might focus on immediate operational metrics like sales and inventory status. Weekly reviews can examine marketing performance and customer trends. Monthly reviews might take a broader view of business health and progress toward strategic goals. Align these report schedules with your business cycles and decision-making processes.
Commit to continuous improvement of your reports. Gather feedback from report users about what’s helpful and what’s confusing. Iterate on report designs to make them more intuitive and actionable. Adapt to changing business needs by adding new metrics or retiring ones that no longer drive decisions.
Invest in training and enablement to maximize the value of your reporting. Educate team members on how to interpret reports correctly, including understanding key metrics and their implications. Build data literacy across your organization so everyone can contribute to and benefit from data-driven insights. Create self-service reporting capabilities where appropriate to empower team members to answer their own questions.
With well-established reporting workflows, your custom reports become more than just information—they become a central part of how your business operates and improves.
Future-Proofing Your Shopify Reporting Strategy
Staying Current with Shopify Analytics Updates
Shopify regularly enhances its analytics capabilities, and staying current with these changes helps you take advantage of new features while avoiding disruption to your reporting system.
Make a habit of monitoring platform changes. Follow Shopify release notes and updates through their blog, email newsletters, or partner announcements. Test new reporting features as they become available to understand their potential benefits for your business. Adapt your reports to leverage new capabilities that could provide deeper insights or greater efficiency.
Develop awareness of Shopify’s analytics feature roadmap when possible. Participate in Shopify beta programs if available to get early access to upcoming features. Engage with the Shopify community through forums or events to gather insights about future developments. Use this awareness to plan for upcoming analytics enhancements in your overall reporting strategy.
Prepare migration strategies for report evolution to minimize disruption during platform changes. Maintain backward compatibility where possible by documenting current report configurations. Document custom report structures, calculated fields, and data sources so you can recreate essential reports if needed. Create transition plans for major platform changes that might affect your reporting workflows.
By staying aligned with Shopify’s analytics evolution, you ensure your reporting remains both powerful and sustainable as the platform develops.
Scaling Your Reporting as Your Business Grows
As your business expands, your reporting needs will evolve—often becoming more complex and specialized. Planning for this evolution ensures your analytics capabilities grow alongside your business.
Expect your metrics focus to shift through different growth stages. In early stages, you might focus heavily on acquisition metrics to build your customer base. As you mature, retention metrics often become more important for sustainable growth. Eventually, you’ll likely incorporate more sophisticated profitability analysis and competitive benchmarking as your business ecosystem becomes more complex.
Consider how your team structure will support data-driven decision making at scale. Clearly define roles and responsibilities for reporting—who creates reports, who maintains them, who acts on insights. Build analytics capabilities within teams through training and hiring. Balance centralized reporting (for consistency and efficiency) with distributed reporting (for specialized team needs).
Lay groundwork for advanced analytics even if you’re not ready for them yet. Prepare for eventual adoption of predictive analytics by ensuring you collect and preserve the historical data you’ll need. Position yourself for AI-driven insights by maintaining clean, well-structured data. Build flexible data infrastructure that can accommodate new types of analysis as your needs grow more sophisticated.
With thoughtful planning, your reporting capabilities can evolve smoothly alongside your business, providing the right insights at each stage of growth.
Integrating Custom Reports into Strategic Planning
The ultimate value of custom reporting comes when it directly influences your strategic direction. Integrating reports into your planning processes creates a virtuous cycle where data shapes strategy and strategy determines what data you track.
Start by aligning reports with business objectives. Create KPI dashboards that directly track progress against your strategic goals. Use reports to monitor advancement toward these goals regularly, not just during annual planning. Identify leading indicators—metrics that predict future performance—so you can make proactive adjustments before problems appear in your bottom line.
Build scenario planning capabilities using your custom reports. Develop what-if analysis approaches to test potential strategies before implementing them. Model different business scenarios to prepare for various market conditions or competitive responses. Use historical data from your reports to inform assumptions about future performance and trends.
Most importantly, create a culture of data-driven decision making throughout your organization. Embed reporting in regular business reviews so teams habitually reference data when making choices. Celebrate successes that resulted from data-informed decisions to reinforce the value of this approach. Learn from instances where data revealed flaws in assumptions or strategies, using these as growth opportunities rather than failures.
When custom reports become an integral part of your strategic thinking—rather than just an operational tool—you’ve truly harnessed the full power of Shopify’s reporting capabilities.
References
- Shopify Help Center. “Create custom reports.” https://help.shopify.com/en/manual/reports-and-analytics/shopify-reports/report-types/custom-reports/create-custom-reports
- Praella. (2024, November 29). “Understanding Shopify Custom Reports: A Guide to Enhanced Data Analytics.” https://praella.com/blogs/shopify-insights/understanding-shopify-custom-reports-a-guide-to-enhanced-data-analytics
- FDGweb. (2024, September 20). “Shopify Plus Advanced Reporting: A Better Way to Track Sales and Inventory.” https://www.fdgweb.com/2024/09/20/shopify-plus-advanced-reporting-a-better-way-to-track-sales-and-inventory/
- Shopify Help Center. “Create a new data exploration.” https://help.shopify.com/en/manual/reports-and-analytics/shopify-reports/report-types/custom-reports/create-custom-explorations
- Mipler. “Shopify Custom Reports.” https://mipler.com/shopify-custom-reports/
- OpenStore. “Advanced Reporting & Analytics | Shopify App Directory.” https://open.store/shopify-apps/advanced-reporting-analytics
Ready to take your Shopify store’s performance to the next level? Growth Suite helps store owners boost sales and revenue through intelligent, data-driven discount campaigns. Unlike standard discount codes, Growth Suite uses AI to create personalized offers that appear at the perfect moment—when customers are most likely to convert. Best of all, it’s free to install with just a single click. Start optimizing your discount strategy today and watch your conversion rates climb!
Also don’t forget to check these articles to learn more about Shopify data and analytics;
