The humble discount code has evolved far beyond a simple markdown on price. In today’s competitive e-commerce landscape, discounts serve as sophisticated tools for customer acquisition, loyalty building, and even inventory management. Yet surprisingly, many Shopify store owners still measure discount success by looking solely at immediate sales bumps. This single-dimensional view misses the rich tapestry of insights discounts can reveal about your business.
Consider this: that 15% off coupon you blasted to your email list generated $5,000 in sales last weekend. Success, right? Maybe. But what if those customers never return? What if your margins eroded below profitability? What if your full-price purchases plummet next month because customers are now trained to wait for the next sale?
Strategic discount measurement transforms these promotional tools from occasional revenue boosters into powerful instruments that drive sustainable business growth. And the good news? Your Shopify store is already capturing much of this data—you just need to know where to look and what to measure.
The Evolving Role of Discounts in E-commerce Strategy
Smart discounting goes well beyond slashing prices to generate quick sales.
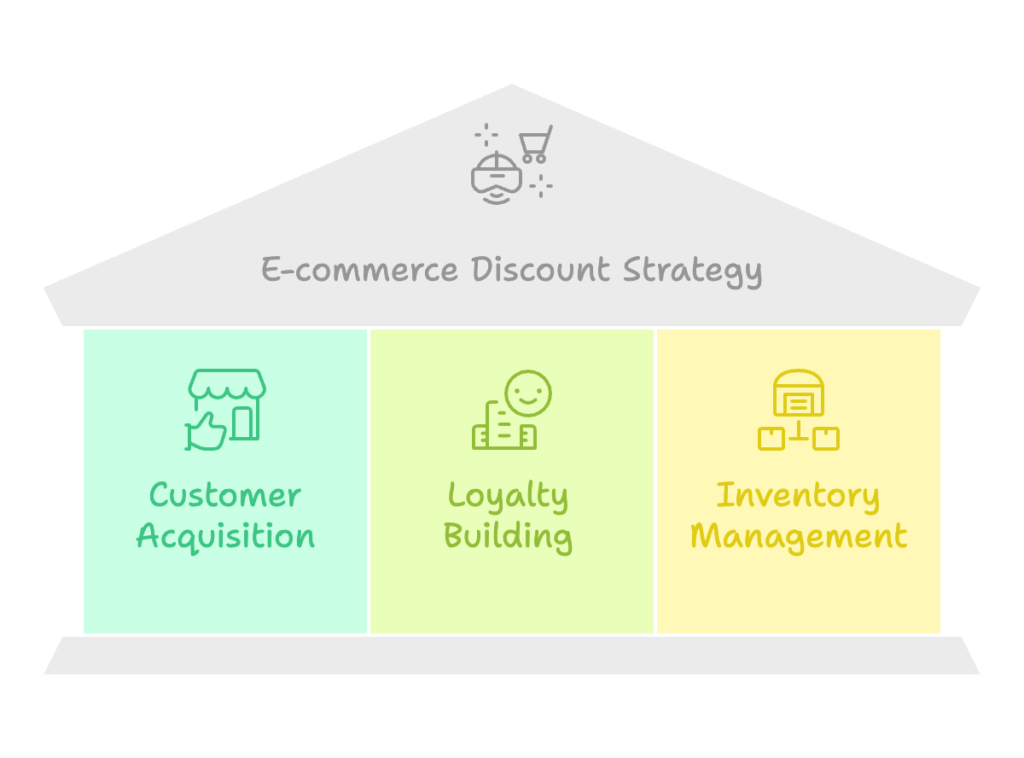
Today’s most successful Shopify merchants use discounts as multi-faceted strategic instruments:
- Customer acquisition tools that lower the barrier to first purchase without devaluing your brand
- Loyalty building mechanisms that reward repeat purchases and incentivize larger cart values
- Inventory management solutions that accelerate the movement of slow-selling or seasonal stock
The trick lies not in offering discounts, but in measuring their true impact across your entire business ecosystem. When you track how discounts affect profitability, customer behavior, and brand perception, you transform a simple price reduction into a strategic advantage.
Why Shopify Store Owners Need Defined Discount Goals
Without clear metrics and goals, discount strategies often lead to two dangerous outcomes: shrinking margins and discount dependency. I’ve seen thriving Shopify stores fall into these traps time and again, with some businesses struggling to sell anything at full price after months of unchecked promotions.
The first step in avoiding these pitfalls is setting concrete goals that align your discount strategy with specific business objectives:
- Preventing discount dependency by monitoring and limiting the frequency of promotions
- Maintaining healthy profit margins by calculating the true cost of discounts across your product range
- Preserving brand value by using targeted, strategic discounts rather than store-wide sales
Effective discount goals connect directly to your broader business objectives—whether that’s rapid growth through new customer acquisition, maximizing lifetime value through repeat purchases, or clearing specific inventory to make room for new products.
Now let’s explore the foundational metrics you should track to ensure your discounts deliver genuine business growth, not just temporary sales spikes.
Foundational Metrics for Discount Performance on Shopify
The difference between haphazard discounting and strategic promotion comes down to measurement. These core metrics provide the foundation for understanding how discounts truly impact your Shopify store.
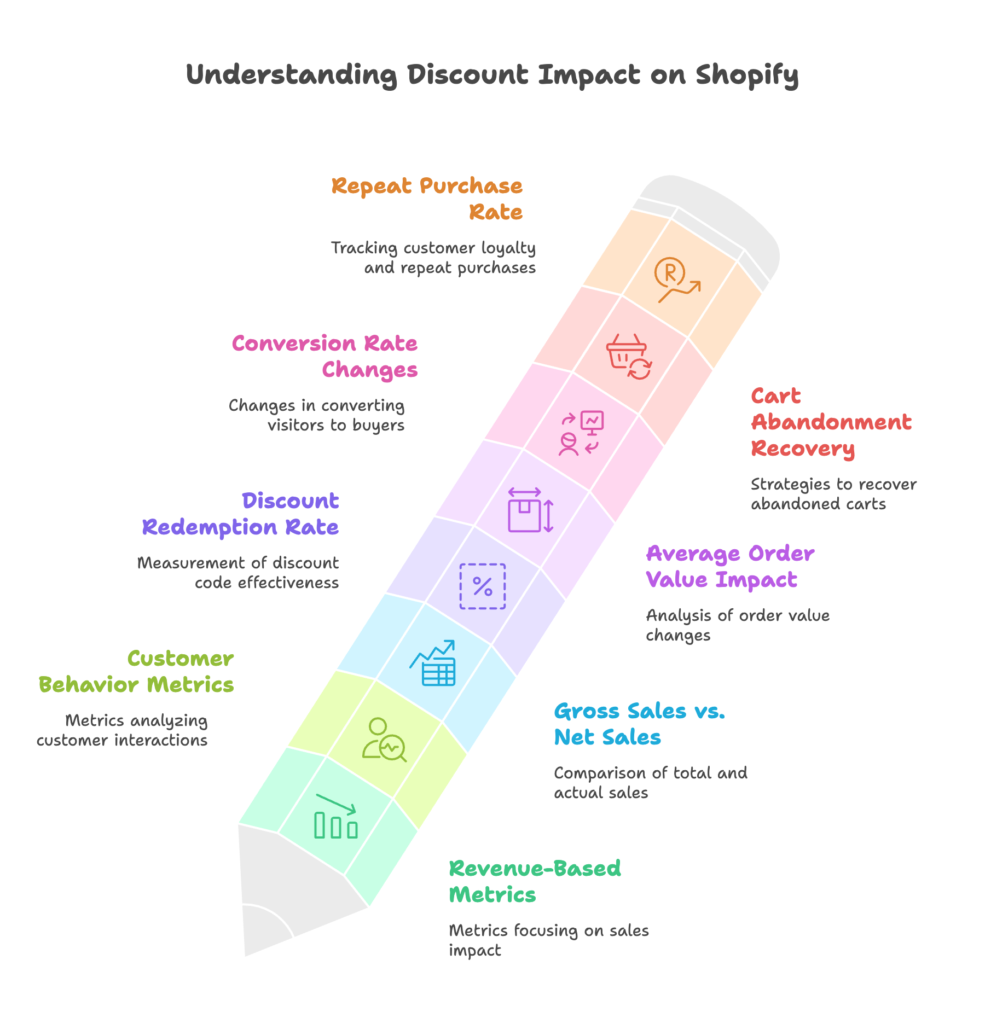
Revenue-Based Metrics
Revenue metrics give you the clearest picture of discount impact on your bottom line. While seemingly straightforward, they contain nuances that many store owners overlook.
Gross Sales vs. Net Sales
Shopify’s reporting makes it easy to see your gross sales, but that top-line number doesn’t tell the complete story. To truly understand discount impact, compare these numbers:
- Gross Sales: The full retail value of products sold before discounts
- Net Sales: What you actually collect after discounts are applied
- Gross Margin After Discount: Your profit after accounting for both product costs and discounts
For example, if you sell a $100 item that costs you $40 to make, your standard margin is 60%. Apply a 25% discount, and the customer pays $75. Your gross margin drops to $35 ($75 minus $40), or just 35% instead of 60%. That’s a 42% reduction in your profit margin from a 25% discount—something many store owners don’t fully calculate.
Discount Redemption Rate
Not all discount codes perform equally. Tracking redemption rates helps identify which codes resonate with customers:
- Calculate: (Number of orders using discount ÷ Number of discount views or distributions) × 100
- Compare: Performance across different discount types (percentage off vs. fixed amount vs. free shipping)
- Identify: Which discount structures drive the highest engagement
If your email-exclusive 15% off code has a 5% redemption rate while your abandoned cart 10% off achieves 25% redemption, you’ve gained valuable insight into when customers are most responsive to discounts.
Average Order Value (AOV) Impact
The right discount can actually increase how much customers spend. Watch these metrics carefully:
- Baseline AOV: Your average order value without discounts
- Discounted AOV: Average order value when discounts are applied
- Threshold Effects: How different spending thresholds (“Spend $100, get 15% off”) affect order values
Many store owners are surprised to discover that certain discount structures—particularly spending thresholds—can lift AOV significantly. I’ve seen stores increase AOV by 35% with a well-designed “spend more, save more” tiered discount strategy compared to flat percentage discounts.
Customer Behavior Metrics
Beyond the immediate revenue impact, discounts significantly influence how customers interact with your store. These behavioral metrics reveal the deeper effects of your discount strategy.
Conversion Rate Changes
Discounts can dramatically affect your store’s ability to turn visitors into buyers:
- Baseline Conversion Rate: Your standard conversion rate without active promotions
- During-Discount Conversion: How conversion rates change when discounts are active
- Post-Promotion Patterns: Whether conversion rates drop below baseline after promotions end
The most telling metric is often what happens after a promotion ends. If your conversion rate drops significantly below your baseline, it may indicate customers are becoming trained to wait for discounts—a dangerous cycle that’s difficult to break.
Cart Abandonment Recovery
Abandoned carts represent a goldmine of potential sales, and discounts can be the perfect tool to recover them:
- Measure: The percentage of abandoned carts recovered through discount offers
- Test: Different discount levels and timing to optimize recovery
- Compare: Recovery rates of discount vs. non-discount recovery emails
The timing of abandonment offers matters tremendously. I’ve worked with stores that increased their recovery rate from 7% to 19% simply by changing when the discount offer was presented—waiting 24 hours rather than sending immediately after abandonment.
Repeat Purchase Rate
Discounts can create either one-time bargain hunters or loyal repeat customers:
- Track: How many discount-using customers make a second purchase within 90 days
- Compare: Repeat purchase behavior between discount-acquired and full-price customers
- Identify: Which discount types create long-term customers versus one-time buyers
This metric often reveals surprising patterns. In some niches, customers acquired through aggressive discounts (40%+) rarely return, while more modest offers (10-15%) often result in higher lifetime value customers who continue to purchase at full price.
Now that we’ve covered the essential metrics, let’s explore how to actually set up and track these goals in your Shopify store.
Setting Up Discount Goals in Shopify
Turning discount tracking from theory into practice requires the right tools and setup in your Shopify store. Let’s walk through how to implement effective goal tracking using both native Shopify features and specialized tools.
Utilizing Shopify’s Native Goal-Setting Features
Shopify offers several built-in features that help track discount performance, though they’re not always obvious to find.
Creating Measurable Goals
The By the Numbers app integrates with Shopify to help establish concrete, measurable goals:
- Navigate to the Goals section in the By the Numbers app
- Select appropriate metrics like sales revenue, orders, or new customers
- Set specific targets with timeframes (weekly, monthly, quarterly)
- Assign discount campaigns to specific goals for clear attribution
For example, you might create a quarterly goal to increase repeat purchase rate by 15% using a series of loyalty-focused discounts. The key is specifying not just the revenue target but the customer behavior you want to influence.
Implementing Discount Tracking
Proper discount setup is crucial for accurate tracking:
- Use unique discount codes for each marketing channel or campaign
- Add UTM parameters to links containing discount offers
- Set expiration dates that align with your measurement periods
- Include descriptive code names that identify the purpose (e.g., “EMAIL-NEWARRIVAL-15” instead of just “SAVE15”)
This structured approach transforms discount codes from simple promotional tools into powerful tracking devices that reveal which channels and approaches drive the most valuable customer behavior.
Discount Performance Monitoring Tools
While native Shopify features provide a good foundation, specialized tools can give you deeper insights into discount performance.
Shopify Analytics Dashboard
The built-in Shopify analytics include several reports relevant to discount tracking:
- Discounts Report: Shows all discount usage, sortable by code, amount, and date
- Sales by Discount: Reveals which discounts drive the most revenue
- Behavior Reports: Connect discount usage to customer actions
To access these insights, navigate to Analytics > Reports > Discounts in your Shopify admin. Export this data regularly (at least monthly) to track patterns over time, as Shopify currently limits historical data access in standard reports.
Third-Party Analytics Integration
For deeper insights, connect your Shopify store to more robust analytics tools:
- Google Analytics: Set up Enhanced Ecommerce to track discount code usage through the purchase funnel
- Custom Reports: Create dedicated discount performance dashboards that combine revenue and behavioral metrics
- Goal Tracking: Establish specific Google Analytics goals tied to discount campaigns
A particularly valuable approach is setting up Google Analytics segments that compare the behavior of discount-using customers versus full-price customers. This reveals profound differences in browsing patterns, product preferences, and lifetime value metrics.
Specialized Discount Apps
Several Shopify apps provide enhanced discount management and analytics:
- Bulk Discount Code Generator: Creates and tracks large numbers of unique codes
- Advanced discount apps: Offer detailed performance reports beyond Shopify’s native capabilities
- Automated alerts: Notify you when discount campaigns hit specific performance thresholds
These specialized tools allow for more sophisticated discount strategies, such as unique single-use codes that can be traced to individual customers, or dynamic discounts that adjust based on customer behavior.
With your tracking foundation in place, let’s examine more advanced metrics that reveal the true business impact of your discount strategy.
Beyond Revenue: Advanced Discount Success Metrics
The most sophisticated Shopify merchants look beyond immediate sales impacts to understand how discounts affect their entire business ecosystem. These advanced metrics reveal the full story of discount performance.
Customer Acquisition Metrics
Discounts often serve as powerful customer acquisition tools, but their true value depends on the quality, not just quantity, of new customers they bring in.
Customer Acquisition Cost (CAC) via Discounts
Understanding the true cost of discount-acquired customers requires looking beyond the discount amount:
- Calculate: (Marketing costs + Total discount amount) ÷ Number of new customers acquired
- Compare: CAC from discount campaigns versus other acquisition channels
- Determine: Maximum sustainable discount for profitable customer acquisition
For example, if your Facebook ad costs $500, offers a 20% discount that totals $2,000 in reduced revenue, and acquires 100 new customers, your CAC is $25 ($500 + $2,000 ÷ 100). Compare this to your average customer lifetime value to determine if this acquisition strategy is profitable.
New vs. Returning Customer Ratio
Different discount strategies attract different customer types:
- Measure: The percentage of discount users who are first-time versus returning customers
- Analyze: How new customers acquired through discounts behave in their first purchase
- Track: Long-term value differences between discount-acquired and organic customers
A healthy discount strategy often shows distinct patterns: broader discounts (15-25%) more effectively acquire new customers, while more exclusive or loyalty-focused offers (10% plus free shipping) tend to drive repeat purchases from existing customers.
Channel-Specific Discount Performance
Not all marketing channels respond equally to discount offers:
- Compare: Conversion rates across different channels using the same discount
- Optimize: Discount types based on channel-specific performance
- Identify: Which channels produce the highest-quality customers through discounts
In my experience, social media audiences often respond better to percentage-based discounts that are easy to understand at a glance, while email subscribers frequently engage more with complex but higher-value offers like tiered discounts or bundles.
Inventory Management Metrics
Strategic discounting can be a powerful inventory management tool when measured correctly.
Sell-Through Rate Improvements
Discounts should accelerate inventory movement in strategic ways:
- Measure: Change in sell-through velocity during discount periods
- Identify: Optimal discount levels for efficient inventory clearance
- Calculate: Carrying cost savings from increased inventory turnover
For seasonal products, calculating the carrying cost savings can be eye-opening. A 30% discount that moves product three months faster may actually be more profitable than holding inventory and eventually discounting deeper later.
Category-Specific Discount Impact
Different product categories often respond uniquely to discounts:
- Analyze: Which categories see the biggest sales lift from promotions
- Measure: Cross-category purchase behavior during discount periods
- Optimize: Category-specific discount strategies based on profit impact
This analysis often reveals surprising opportunities. I’ve seen stores discover that discounting accessories actually drives more full-price purchases of higher-margin main products, creating a more profitable overall strategy than discounting the main products themselves.
Customer Lifetime Value (CLV) Impact
Perhaps the most important but least measured discount metric is how promotions affect long-term customer value.
Discount Influence on CLV
Discounts can either enhance or diminish long-term customer value:
- Measure: 6-month and 12-month spending of discount-acquired versus full-price customers
- Compare: Future full-price purchase rates between customer groups
- Identify: Which discount structures lead to highest lifetime value
The patterns here often contradict conventional wisdom. In many niches, customers acquired through modest, strategic discounts (10-15%) actually show higher lifetime values than those who purchase at full price initially, possibly because they feel they’ve discovered a good value and return more frequently.
Loyalty Program Integration
Combining discounts with loyalty initiatives can amplify value:
- Measure: Engagement lift when discounts integrate with loyalty programs
- Calculate: Optimal balance between discount offers and loyalty rewards
- Track: How combined approaches affect customer retention versus discounts alone
For example, offering members-only discounts that require loyalty program enrollment can convert one-time shoppers into program members with 40-60% higher lifetime values, even accounting for the discount cost.
Now let’s look at how to design discount strategies around these measurable goals.
Designing Discount Strategies with Measurable Goals
With clear metrics established, it’s time to craft discount strategies specifically designed to achieve measurable business objectives. Different discount structures serve different goals—here’s how to match them effectively.
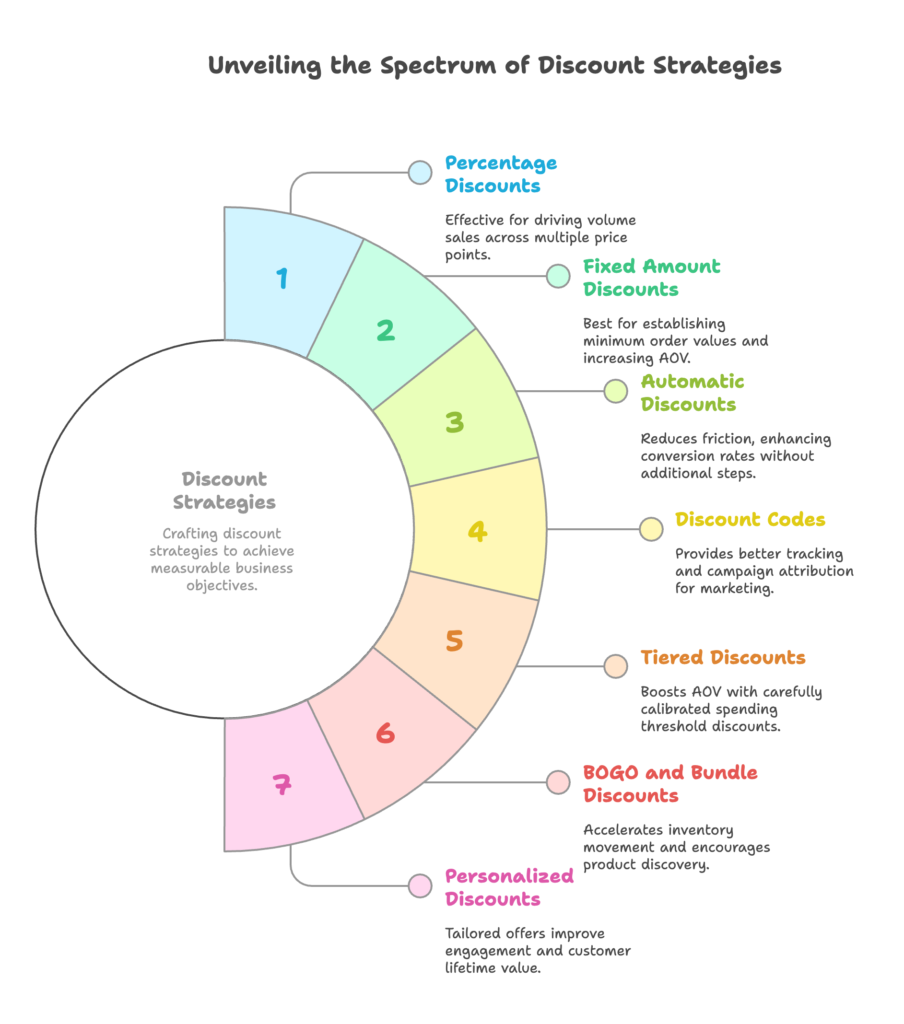
Percentage vs. Fixed Amount Discounts
These two fundamental discount types produce distinctly different customer responses and business outcomes.
Comparative Performance Analysis
Understanding when to use each discount type starts with analyzing their performance:
- Customer Perception: Percentage discounts often feel more valuable on higher-priced items, while fixed amounts appear more substantial for lower-priced goods
- Conversion Impact: Test identical value offers (e.g., 20% off vs. $20 off on a $100 item) to see which drives higher conversion
- Profit Analysis: Calculate the margin impact across different price points in your catalog
The most insightful approach is A/B testing identical-value offers. For instance, one store I worked with found that “$25 off” significantly outperformed “15% off” on a $167 product—despite the percentage discount being worth more ($25.05). The concrete dollar amount created stronger perceived value.
Setting Specific Goals for Each Discount Type
Align discount structures with specific objectives:
- Percentage Discounts: Often best for driving volume sales across multiple price points and product categories
- Fixed Amount Discounts: Typically more effective for establishing minimum order values and increasing AOV
- Testing Framework: Create a systematic approach to measure each discount type against your priority metrics
For example, if increasing AOV is your primary goal, test a fixed “$15 off orders over $75” against a “20% off” of roughly equivalent value. Track not just conversion rates but also average order values and units per transaction to see which better achieves your specific objective.
Automatic Discounts vs. Discount Codes
Shopify offers both automatic discounts (applied without codes) and traditional discount codes—each with distinct advantages for different goals.
Performance Measurement Differences
The choice between automatic discounts and codes affects both customer experience and tracking capabilities:
- Automatic Discounts: Create less friction but can be harder to attribute to specific marketing channels
- Discount Codes: Provide better tracking and campaign attribution but add a step to the checkout process
- Customer Journey: Analyze how each approach affects browse-to-buy behavior and cart abandonment
Measuring the true impact requires looking beyond simple conversion rates. For instance, automatic discounts typically show 5-15% higher initial conversion rates, but discount codes often lead to better attribution data and sometimes higher AOV as customers become aware of spending thresholds.
Strategic Implementation Based on Goals
Choose your approach based on primary objectives:
- Conversion Optimization: Use automatic discounts for reducing friction in high-intent scenarios like cart abandonment recovery
- Marketing Engagement: Leverage codes for tracking campaign performance and creating a sense of exclusivity
- Hybrid Approaches: Combine both methods for different stages of the customer journey
One effective hybrid strategy I’ve implemented with clients involves using automatic discounts for on-site promotions targeting first-time visitors (reducing friction) while using unique discount codes for email marketing to existing customers (enhancing tracking and creating a sense of personalized value).
Advanced Discount Structures
Beyond basic percentage or fixed discounts, sophisticated structures can achieve specific business goals when properly measured.
Tiered Spending Threshold Discounts
These powerful AOV-boosters require careful calibration:
- Set Measurable Goals: Define specific AOV targets for each spending tier
- Determine Thresholds: Analyze your order value distribution to identify natural breakpoints
- Measure Long-term Impact: Track whether customers maintain higher spending after promotions end
The most effective threshold discounts sit just above your current AOV. If your store averages $65 orders, a “Spend $75, get 15% off” offer typically drives more incremental revenue than a $100 threshold would. The key metric is what percentage of customers “stretch” to reach the threshold versus how many would have spent that much anyway.
BOGO and Bundle Discount Metrics
Buy-one-get-one and bundle offers serve specific inventory and discovery goals:
- Inventory Movement: Measure how BOGO offers accelerate specific product sell-through
- Margin Impact: Calculate blended margins across bundled products
- Product Discovery: Track how many customers re-purchase previously unknown products
The most telling metric for BOGO and bundle offers isn’t immediate sales but downstream effects. For example, a “Buy any shirt, get 50% off shorts” promotion should be judged not just on immediate revenue but on how many customers later return to purchase shorts at full price, indicating successful category discovery.
Personalized Discount Performance
Tailored offers based on customer data represent the future of strategic discounting:
- Engagement Rates: Measure open, click, and conversion rates for personalized versus generic offers
- Conversion Comparison: Test identical discount values delivered in personalized versus standard formats
- ROI Calculation: Determine whether the improved performance justifies the technology investment
Personalization typically yields dramatic improvements—I’ve seen stores achieve 30-40% higher conversion rates with personalized offers versus generic ones, even when the discount amount is identical. The key is measuring not just immediate conversions but also how personalization affects customer lifetime value.
Now that we’ve covered strategic design, let’s address common pitfalls in discount measurement that can lead to incorrect conclusions.
Avoiding Common Discount Measurement Pitfalls
Even with strong measurement practices in place, several common errors can lead to misinterpreting discount performance. Let’s explore how to avoid these pitfalls and ensure accurate discount evaluation.
Correlation vs. Causation in Discount Analysis
One of the most common mistakes is attributing all sales changes to your discount when other factors may be responsible.
Isolating Discount Impact from Other Factors
To accurately measure discount performance:
- Use Control Groups: When possible, show the discount to only a segment of your audience while others see the regular price
- Account for Seasonality: Compare performance against the same period in previous years or similar seasonal events
- Implement A/B Testing: Test different discount structures simultaneously to isolate their specific impacts
For example, rather than discounting your entire store, test a 15% off promotion with 50% of your email list while the other half receives a non-discount message. This approach lets you measure the true incremental value of the discount by controlling for other factors.
Multi-touch Attribution Challenges
Discounts rarely work in isolation—they’re usually part of a broader purchase journey:
- Journey Analysis: Map where discounts appear in the typical customer path to purchase
- Attribution Modeling: Implement first-touch, last-touch, or multi-touch attribution models to accurately credit sales
- Influence Measurement: Track how discounts affect conversion rates across different touchpoints
A common mistake is giving full credit to a discount code used at checkout when the purchase decision was actually driven by product quality, reviews, or other marketing touchpoints. More sophisticated attribution modeling reveals each element’s contribution to the final sale.
Short-term vs. Long-term Measurement
Perhaps the most dangerous pitfall is focusing exclusively on immediate results without considering long-term effects.
Balancing Immediate Results with Sustainable Growth
Strategic discount measurement requires both short and long-term perspectives:
- Set Appropriate Timeframes: Establish measurement windows that match your customer purchase cycle
- Measure Post-Promotion Effects: Track how sales perform in the weeks following discount periods
- Calculate True ROI: Include both immediate gains and subsequent impacts in your evaluation
One revealing approach is tracking the “discount hangover”—how much sales drop below baseline after a promotion ends. If a 3-day, 20%-off sale generates $10,000 in revenue but is followed by a week of sales that are $8,000 below normal, the promotion actually produced a net $2,000 increase rather than $10,000.
Preventing Discount Dependency
The most insidious long-term effect is customers becoming conditioned to only purchase at discount prices:
- Track Full-Price Purchase Rates: Monitor the percentage of customers who ever make a full-price purchase after using a discount
- Measure Discount Sensitivity: Analyze how conversion rates change at different discount levels
- Identify Warning Signs: Watch for declining response to the same discount percentage over time
A particularly telling metric is your “discount elasticity”—how much each additional percentage point of discount increases conversion rates. When stores become discount-dependent, this elasticity often decreases, requiring ever-deeper discounts to generate the same response.
With these pitfalls in mind, let’s look at how to implement a comprehensive framework for discount measurement.
Implementing a Discount Measurement Framework
Turning all these insights into a practical system requires structure and consistency. Here’s how to implement a sustainable discount measurement framework for your Shopify store.
Creating a Discount Testing Calendar
Systematic testing yields the most reliable insights about discount effectiveness.
Structured Approach to Discount Experimentation
Develop a methodical testing schedule:
- Plan Diverse Tests: Schedule different discount types throughout the year to compare performance
- Allow Measurement Windows: Ensure adequate time between major promotions to measure baseline performance
- Align with Business Cycles: Coordinate discount testing with your seasonal patterns and inventory needs
An effective calendar might include testing percentage discounts in January, threshold-based offers in March, bundle promotions in May, and loyalty-focused discounts in August. This systematic rotation provides comparative data on which strategies work best during different business cycles.
Establishing Baseline Metrics
You can’t measure change without understanding your starting point:
- Document Normal Performance: Establish clear benchmarks for regular business periods
- Create Benchmark KPIs: Set standard metrics for comparison across all discount campaigns
- Record Seasonal Variations: Note how baseline metrics naturally fluctuate throughout the year
For most Shopify stores, I recommend tracking at least 3-4 weeks of baseline data before any major discount campaign. This should include conversion rates, AOV, units per transaction, and browse-to-buy ratios—all metrics that discounts directly influence.
Building a Comprehensive Discount Dashboard
Centralized tracking dramatically improves discount strategy decision-making.
Key Metrics to Include
An effective discount dashboard should track:
- Revenue Metrics: Gross sales, net sales after discount, margin impact, incremental revenue
- Customer Behavior: Conversion rates, AOV, units per transaction, browse time
- Inventory Impact: Category sell-through rates, inventory turnover velocity
- Long-term Indicators: Repeat purchase rates, customer acquisition costs, lifetime value
The most useful dashboards compare these metrics across different discount types, customer segments, and time periods, making patterns and insights immediately visible.
Implementation in Shopify
Several approaches can create your measurement hub:
- Native Reporting: Utilize Shopify’s built-in analytics, especially the Discounts Report
- Third-Party Tools: Integrate specialized analytics platforms like Google Analytics or dedicated Shopify apps
- Custom Solutions: For advanced needs, export data to spreadsheets or business intelligence tools
A practical approach for most stores combines Shopify’s native reports with Google Analytics for deeper customer behavior insights, plus a simple spreadsheet tracking long-term metrics not easily available in either platform.
Continuous Optimization Process
Discount strategy is never “set and forget”—it requires ongoing refinement based on performance data.
Regular Review Cadence
Establish a consistent schedule for discount performance evaluation:
- Weekly Check-ins: Quick reviews of active campaigns and immediate performance
- Monthly Analysis: Deeper reviews of completed promotions with strategy adjustments
- Quarterly Assessment: Comprehensive evaluation of discount strategy against business goals
The most successful merchants I’ve worked with treat this cadence as non-negotiable, ensuring discount strategies evolve based on actual performance rather than assumptions or industry trends.
Data-Driven Decision Making
Transform metrics into actionable improvements:
- Set Clear Thresholds: Establish specific performance levels that define success for each metric
- Develop Action Plans: Create standardized responses for underperforming discounts
- Scale Winners Systematically: Establish a process for expanding successful discount approaches
For example, you might determine that any discount driving less than a 3x return on discount investment gets redesigned, while those achieving 5x or better get expanded to additional customer segments or product categories.
The ultimate goal of this framework isn’t perfect discount design from the start, but rather a system that continuously improves based on real customer response and business impact.
References
- Databox. (2025). Shopify Discounts – Metric Definition. Retrieved from https://databox.com/metric-library/metrics/shopify/discounts
- F22 Labs. (2024). How to Use Shopify’s Discount Features to Increase Sales. Retrieved from https://www.f22labs.com/blogs/how-to-use-shopifys-discount-features-to-increase-sales/
- Shopify. (2024). 7 Effective Discount Pricing Strategies to Increase Sales. Retrieved from https://www.shopify.com/enterprise/blog/pricing-strategies-discount-strategies-and-tactics
- By the Numbers. (2024). Introducing Goals – Achieve Shopify Success. Retrieved from https://www.bythenumbersapp.com/introducing-goals/
- Shopify Help Center. (n.d.). Discounts. Retrieved from https://help.shopify.com/en/manual/discounts
Ready to transform your Shopify store’s discount strategy with data-driven insights? Growth Suite helps you create personalized, strategic discount campaigns that boost sales without sacrificing margins. Our AI-powered engine analyzes customer behavior to offer the right discount to the right visitor at the perfect moment—plus comprehensive analytics to measure true performance across all the metrics we’ve discussed. Get started with Growth Suite today—it’s free to install in just one click from the Shopify App Store!
Don’t forget to checkout other articles;



[…] Setting Discount Goals: Defining Success Metrics Beyond Revenue […]