![]()

Your Shopify blog is quietly working behind the scenes, but are you truly capturing its value? For many store owners, blogging feels like shouting into the void—creating content without knowing if it’s actually driving sales. The truth is, without proper measurement, your blog is just a collection of words rather than a strategic business asset.
I’ve worked with hundreds of Shopify stores, and I’ve seen firsthand how a data-driven blog strategy can transform a store’s performance. One fashion retailer I consulted with increased their organic traffic by 143% in just six months by optimizing their content based on performance metrics. Another home goods store attributed over $24,000 in quarterly revenue directly to blog-originated customer journeys.
The difference between blogs that drive significant revenue and those that don’t? Measurement. Let’s dive into exactly how you can track, analyze, and optimize your Shopify blog using metrics that actually matter to your bottom line.
The Role of Blogging in Shopify Store Success
Your blog isn’t just a publishing platform—it’s a sophisticated marketing engine with multiple functions. Understanding these functions helps you measure what matters most.
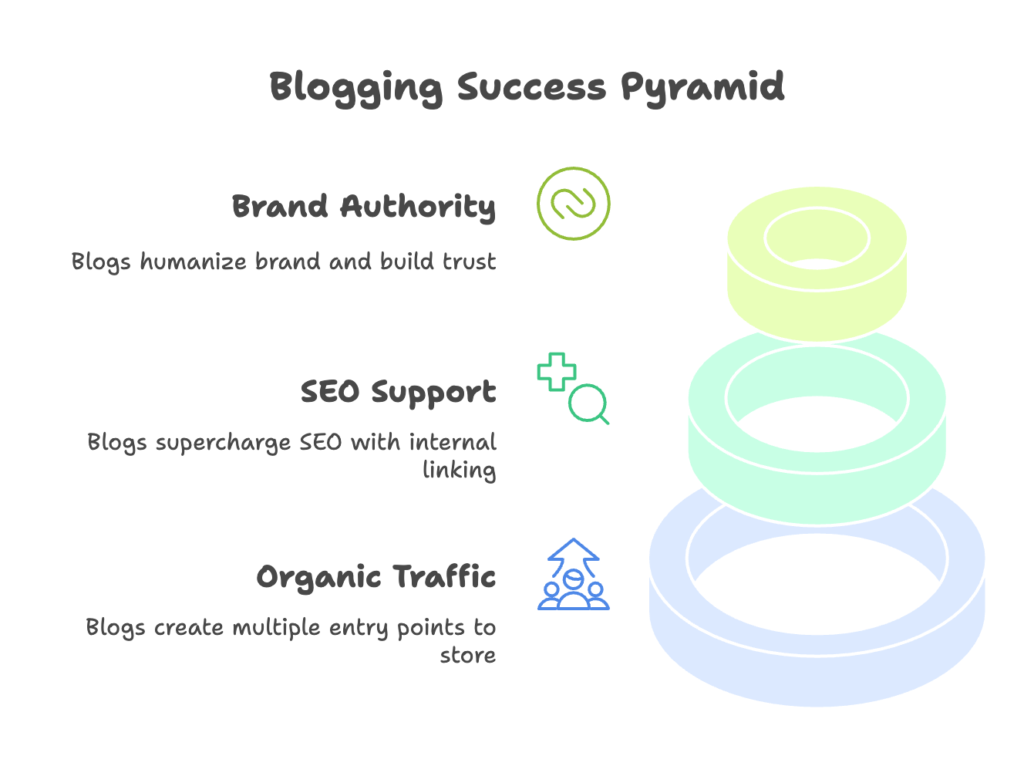
Driving Organic Traffic Through Content
A well-executed blog strategy creates multiple entry points to your store. Instead of relying solely on your homepage and product pages to attract visitors, each blog post serves as another doorway for potential customers to discover you.
This expanded digital footprint matters tremendously. Consider this: product pages typically target high-intent but low-volume keywords like “organic cotton baby onesie with snaps.” Blog content, however, can capture broader, information-seeking queries like “how to choose baby clothes for sensitive skin” or “best fabrics for newborn clothing.” These informational searches represent a much larger audience at the top of your sales funnel.
More importantly, consistently publishing quality content signals to search engines that your site is active and authoritative. I’ve seen Shopify stores double their organic visibility within three months simply by implementing a strategic publishing schedule.
Supporting SEO Efforts
Your blog supercharges your SEO strategy in ways product pages alone cannot. While product pages are naturally limited to commercial keywords, your blog can target the entire spectrum of search intent.
Beyond keyword expansion, blogging creates opportunities for internal linking—helping search engines understand your site architecture and distribute page authority throughout your store. This interconnected content ecosystem demonstrates topical expertise to search engines.
The link-earning potential of great blog content shouldn’t be underestimated either. Product pages rarely attract natural backlinks, but insightful, data-driven, or inspirational blog posts do. One kitchen supply Shopify store I worked with earned links from food bloggers and even major publications through their comprehensive cooking guides—links that would have cost thousands in outreach campaigns.
Building Brand Authority and Customer Relationships
Your blog humanizes your brand. It transforms you from a faceless online store into a trusted advisor with personality and expertise. This transformation isn’t just nice to have—it directly impacts conversion rates.
When potential customers land on a product page, they’re evaluating not just the product but your credibility as a seller. Having discovered your helpful buying guide or informative comparison article builds pre-purchase trust that can significantly improve conversion rates.
Blog content also supports customers throughout their journey. From awareness-stage educational content to post-purchase usage tips, your blog creates multiple touchpoints that strengthen customer relationships and encourage loyalty.
Why Measuring Blog Performance Matters
Creating content without measuring performance is like driving with your eyes closed. You might reach your destination through sheer luck, but the journey will be inefficient and potentially disastrous.
Data-Driven Content Strategy
Blog analytics reveal patterns that would otherwise remain invisible. Which topics resonate most with your audience? What content formats drive the highest engagement? When is your audience most receptive to your content? The answers lie in your data.
With these insights, you can double down on what works. One beauty brand I consulted discovered their tutorial-style posts consistently outperformed their trend reports by a 3:1 margin in terms of both traffic and conversions. This single insight allowed them to reallocate resources to create more of their highest-performing content type.
Performance data also highlights audience preferences you might not have anticipated. A pet supply store was surprised to find their most technical ingredient analysis posts outperformed their cute pet photo roundups in both engagement and conversion metrics—countering their intuition but revealing their audience’s true information needs.
ROI Justification for Content Marketing
Content creation requires investment—whether in your time or in hiring writers, designers, or editors. Without measuring performance, you can’t determine if that investment is yielding returns.
Proper tracking allows you to quantify your blog’s contribution to revenue. Is your blog generating $500 or $5,000 in monthly sales? Is your content marketing delivering a higher ROI than your Facebook ads? Should you hire another content creator or reallocate that budget elsewhere?
These questions are impossible to answer without robust measurement systems in place. With proper tracking, one electronics Shopify store I worked with discovered their blog was quietly generating 22% of their total revenue through organic search traffic—justifying a substantial increase in their content budget.
Continuous Improvement Opportunities
Even high-performing blogs have room for improvement, and analytics reveal exactly where those opportunities lie. Perhaps your traffic is strong but your conversion rate is weak. Maybe visitors read halfway through your posts before abandoning them. Or perhaps certain topics draw traffic but fail to generate sales.
These insights enable targeted optimization. One home decor Shopify store improved their blog conversion rate by 37% simply by addressing the specific drop-off points revealed in their analytics. They discovered visitors were highly engaged with their content but weren’t continuing to product pages—leading them to redesign their CTAs and content-to-product linking strategy.
Analytics also help you identify underperforming content worth refreshing. Updating old posts often yields faster results than creating new ones, as they already have established search signals and backlinks. A systematic content refresh strategy helped one outdoors equipment retailer reclaim top search positions for key terms without creating any new posts.
Setting Up Analytics for Your Shopify Blog
Effective measurement begins with proper setup.
Let’s walk through how to configure the essential analytics tools that will track your blog’s performance.
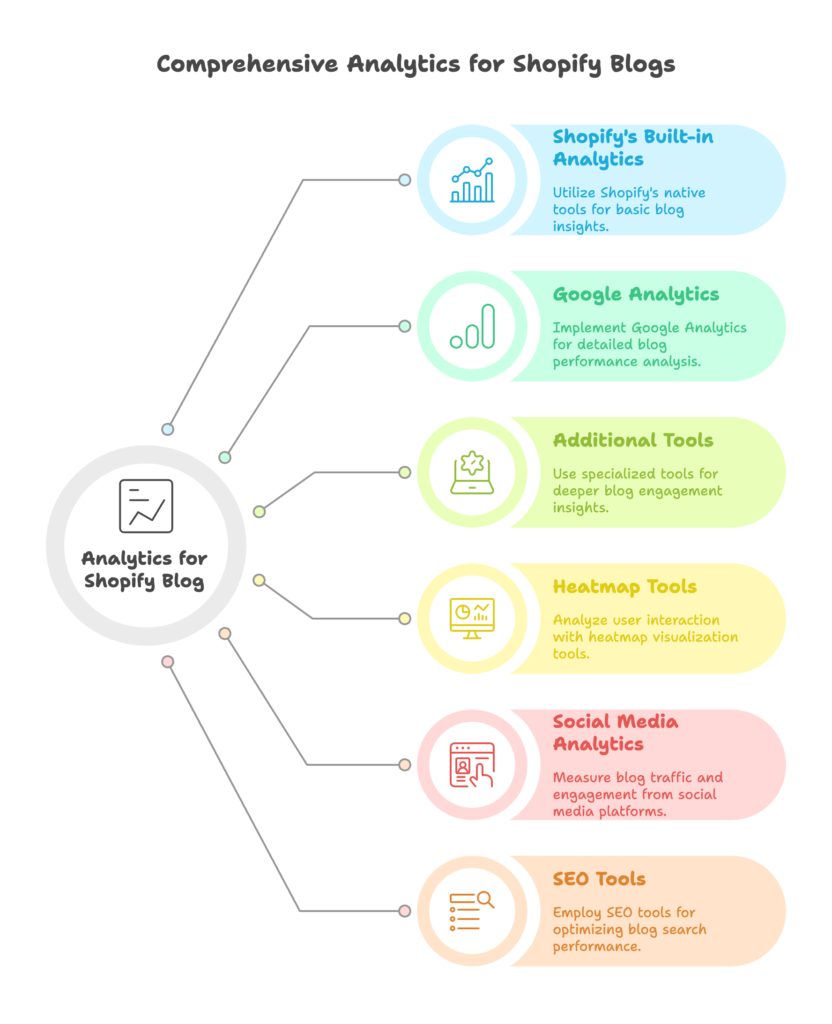
Leveraging Shopify’s Built-in Analytics
Shopify provides native analytics capabilities that, while not comprehensive for blog analysis, offer valuable starting points—especially for understanding how blog traffic connects to purchases.
Accessing Shopify Analytics Dashboard
Your journey begins in the Analytics section of your Shopify admin panel. Navigate to Analytics → Dashboards to view your store’s performance at a glance. While the default dashboard focuses on sales metrics, you can customize it to include blog-specific data points.
The “Online store sessions by landing page” report is particularly valuable for blog analysis. It shows which blog posts are driving the most traffic to your store. To access this report, go to Analytics → Reports → Sessions attributions by landing page.
For a quick overview of how your blog is contributing to your store’s traffic, check the Acquisition reports under Analytics → Reports → Acquisition. Here you’ll see traffic sources including “Blog posts” as a distinct category.
Utilizing Shopify’s Report Builder
For more customized blog performance insights, Shopify’s Report Builder (available on higher-tier plans) allows you to create tailored reports. Go to Analytics → Reports → Build custom report to access this feature.
Create a report that combines blog traffic with conversion metrics by selecting dimensions like “Landing page” and “Referrer” alongside metrics like “Total sales” and “Conversion rate.” Save this report to monitor how different blog posts influence purchasing behavior over time.
You can also schedule these reports to be delivered to your email regularly, keeping blog performance top of mind without having to manually check the dashboard.
Understanding Shopify Analytics Limitations
While useful, Shopify’s native analytics have constraints for comprehensive blog analysis. Data retention varies by plan level—Basic Shopify stores retain 90 days of data, while higher plans store up to a year. This limitation makes long-term trend analysis challenging without exporting data regularly.
Additionally, Shopify’s analytics focus primarily on sales-oriented metrics rather than content engagement. You’ll get useful information about how blog posts lead to transactions but limited insights into user behavior within your content.
Finally, the native integration capabilities with other marketing tools are restricted, making it difficult to connect blog performance with broader marketing initiatives. These limitations explain why serious Shopify bloggers supplement native analytics with additional tools.
Integrating Google Analytics with Your Shopify Blog
Google Analytics provides deeper insights into blog performance than Shopify’s native tools, offering a comprehensive view of user behavior, traffic sources, and conversion paths.
Setting Up Google Analytics on Shopify
Begin by creating a Google Analytics account if you don’t already have one. Navigate to analytics.google.com and follow the setup process. For most Shopify stores, I recommend using Google Analytics 4 (GA4) as it offers more advanced tracking capabilities and will be the standard moving forward.
To connect Google Analytics to your Shopify store, you’ll need to add your tracking ID to your Shopify admin. Go to Online Store → Preferences, then scroll to the Google Analytics section. Enter your tracking ID and check the box for “Use Enhanced Ecommerce.”
For the most accurate data, enable the “Exclude all pageviews from internal traffic” option to filter out your own visits to your blog. Also ensure you’ve set up proper UTM parameters for any promotional links to your blog content to accurately track campaign performance.
Creating Blog-Specific Views and Segments
To isolate blog performance in Google Analytics, create a custom segment for blog traffic. In GA4, navigate to Explore → New exploration → Segments → Create segment. Define the segment with a condition where “Page path” contains “/blogs/” (adjust if your blog uses a different URL structure).
This segment allows you to analyze only blog traffic across all reports, providing cleaner insights into content performance without the noise of product page or checkout traffic.
Next, set up goals specific to blog performance. While purchase completion is an obvious goal, consider adding intermediate goals like:
- Blog to product page navigation
- Email newsletter signup from blog posts
- Time on page exceeding 2 minutes (indicating deep engagement)
- Multiple page views in a single session (showing content exploration)
These goals help you measure the effectiveness of your blog beyond direct sales attribution.
Enabling Enhanced E-commerce Tracking
Enhanced E-commerce tracking is crucial for understanding how blog content contributes to purchase behavior. It allows you to see the complete customer journey from initial blog visit through to final purchase.
Verify that Enhanced E-commerce is properly configured by checking your Google Analytics settings. In GA4, navigate to Admin → Data Streams → select your web stream → Configure tag settings → Enhanced measurement. Ensure this is toggled on.
With Enhanced E-commerce properly set up, you can track which blog posts initiate purchase journeys, which influence purchases (even if they’re not the first touch), and the average value of orders influenced by blog content.
Pay particular attention to attribution models when analyzing blog contribution to sales. The default “last-click” attribution often undervalues blog content since it typically introduces customers to your brand but isn’t usually the final touchpoint before purchase. Consider using models like “first interaction” or “position based” to better capture blog influence.
Implementing Additional Analytics Tools
While Shopify analytics and Google Analytics form the foundation of your measurement stack, specialized tools provide deeper insights into specific aspects of blog performance.
Heatmap and User Behavior Tools
Aggregate metrics tell you what is happening on your blog, but heatmap tools show you how visitors interact with your content. These visual analytics reveal where users click, how far they scroll, and which elements capture attention or get ignored.
Hotjar is particularly useful for blog analysis, offering scrollmaps that show the percentage of visitors who reach each section of your posts. This insight can help you identify where readers lose interest or where to strategically place CTAs for maximum visibility.
Lucky Orange provides session recordings that allow you to watch anonymous visitors navigate your blog. These recordings often reveal usability issues or confusion points that quantitative data might miss. I’ve seen Shopify store owners have “aha moments” watching users struggle to find products mentioned in blog posts—leading to improved internal linking strategies.
Crazy Egg specializes in click tracking, showing exactly which links, buttons, and elements visitors interact with. This data helps optimize your call-to-action placement and understand which types of links (text vs. buttons vs. images) perform best within your blog content.
SEO-Specific Analytics Tools
Since organic search typically drives the majority of blog traffic, dedicated SEO tools provide crucial performance data.
Google Search Console is essential and free. It shows which search queries bring visitors to your blog, your average positions for those queries, and your click-through rates from search results. The Performance report for specific URLs helps you understand how individual blog posts perform in search and identify optimization opportunities.
For competitive keyword tracking, tools like Ahrefs or SEMrush allow you to monitor ranking positions over time. They also provide valuable content gap analysis—showing you topics your competitors rank for that your blog doesn’t yet cover.
Backlink analysis tools like Moz track which of your blog posts earn links from other websites. Since backlinks remain a key ranking factor, identifying your most link-worthy content helps inform future content creation. One craft supply Shopify store discovered their detailed tutorial posts earned 5x more backlinks than their product roundups—pivoting their strategy accordingly.
Social Media Analytics Integration
Social media often drives significant traffic to blog content, making these platforms’ native analytics valuable for performance measurement.
Tools like Buffer or Hootsuite allow you to track social shares, engagement, and click-throughs from social platforms to your blog. This data helps identify which content formats and topics resonate most on social channels and optimize your promotion strategy.
When properly tagged with UTM parameters, social traffic can be analyzed in Google Analytics to understand which platforms drive not just visits but conversions. This data often reveals surprising insights—for example, one jewelry Shopify store discovered that while Instagram drove more blog traffic, Pinterest visitors had a 3x higher conversion rate and 27% higher average order value.
For a complete view of social performance, connect your social analytics to your overall reporting dashboard. Tools like Databox or Google Data Studio allow you to create unified dashboards pulling data from multiple sources.
Essential Traffic and Engagement Metrics
Now that your tracking infrastructure is in place, let’s examine the fundamental metrics that reveal how well your blog is attracting and engaging visitors.
Measuring Blog Traffic Volume and Sources
Traffic metrics form the foundation of blog performance analysis. While they don’t tell the complete story, they provide essential context for all other measurements.
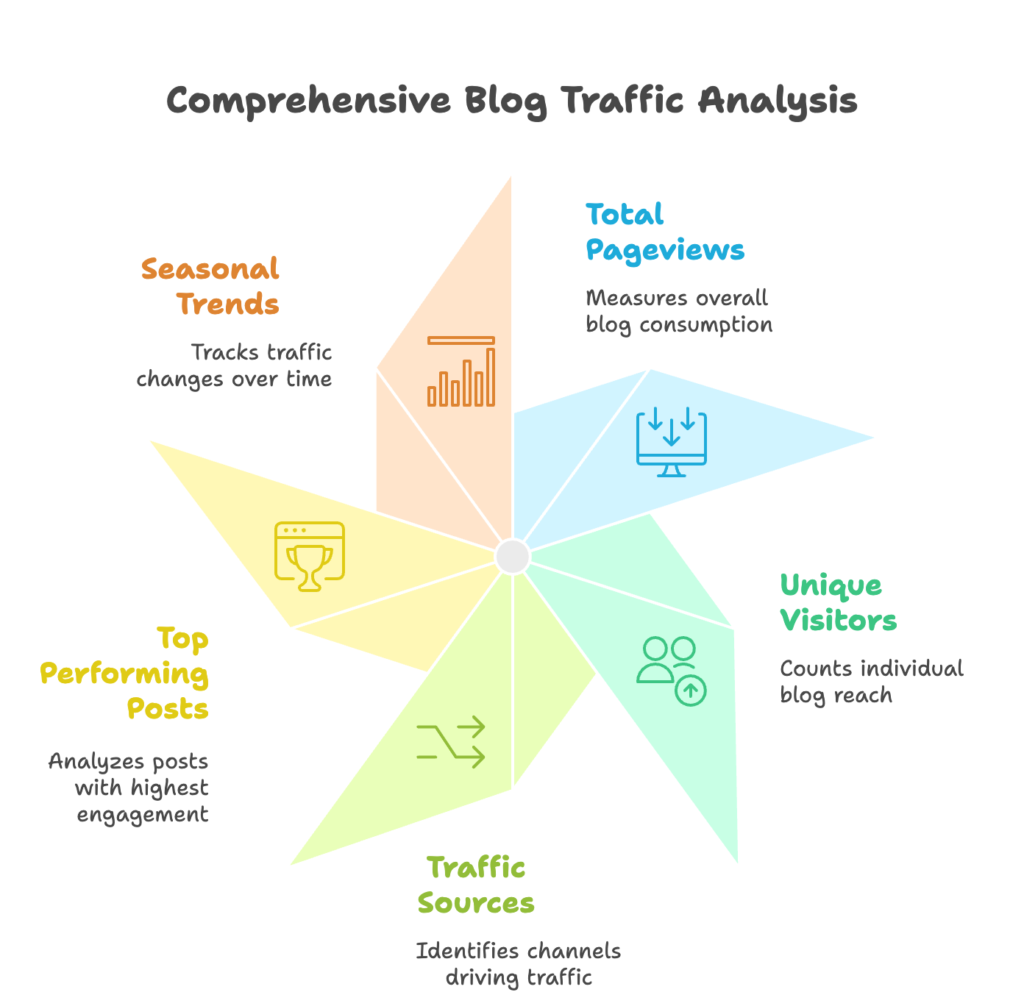
Total Pageviews and Unique Visitors
Pageviews represent the total number of times your blog posts were viewed, including repeat views by the same visitor. This metric helps you understand overall blog consumption but can be inflated by a small number of highly engaged visitors revisiting the same content.
Unique visitors (or users in Google Analytics) gives you a clearer picture of your blog’s reach by counting individual people rather than total views. Tracking the ratio between pageviews and unique visitors reveals your “pages per session” metric—a useful indicator of content exploration. A ratio above 1.5 typically indicates readers are engaging with multiple blog posts, suggesting strong internal linking and relevant content recommendations.
When analyzing traffic growth, focus on trends rather than absolute numbers. Is your traffic steadily increasing month-over-month? Are there seasonal patterns? One gardening supply Shopify store saw 300% traffic spikes in early spring—allowing them to time their most commercially-focused content for this high-traffic period.
Traffic Sources and Channels
Understanding where your blog traffic comes from reveals which promotion channels are working and which deserve more attention.
Organic search traffic percentage is particularly important for blogs. A healthy blog typically sees 60-70% of traffic from organic search after 6-12 months of consistent publishing. If your organic percentage is significantly lower, it may indicate SEO opportunities or content that doesn’t align with search intent.
Social media referrals show which platforms resonate with your content. Different blog topics often perform distinctly across platforms—one beauty Shopify store found their ingredient-focused posts performed best on Pinterest while their application tutorials thrived on Instagram.
Direct traffic and newsletter referrals indicate brand loyalty and audience engagement. Growing direct traffic suggests people are bookmarking your blog or typing your URL directly—strong indicators of content value.
Internal traffic from other store pages helps you understand how well your site architecture connects shoppers with relevant content. If this number is low, consider improving internal linking from product pages to relevant blog posts and vice versa.
Top Performing Blog Posts
Identifying your traffic winners provides insights into topics and formats that resonate with your audience.
When analyzing top posts, look beyond raw pageview numbers to examine traffic quality metrics like time on page and conversion rate. Some posts might drive substantial traffic but minimal engagement, while others bring fewer but more qualified visitors.
Break down traffic patterns by topic to identify subject matter that consistently performs well. Categorize your posts into topic clusters and analyze aggregate performance to inform future content planning.
Understanding seasonal traffic fluctuations is crucial for content strategy. Some posts may perform cyclically—like gift guides during holiday seasons or outdoor living content in summer months. Identifying these patterns allows you to refresh seasonal content before peak periods and promote it strategically.
Evaluating User Engagement
Traffic tells you how many people visited your blog, but engagement metrics reveal whether they found value in your content.
Time on Page and Bounce Rate
Average time on page indicates how long visitors spend consuming your content. This metric serves as a proxy for quality and relevance—longer times generally suggest more valuable content.
Benchmark appropriate time on page based on content length and type. A 3,000-word comprehensive guide might reasonably expect 5-7 minutes of engagement, while a 500-word news update might see 1-2 minutes. Context matters tremendously here.
Bounce rate measures the percentage of visitors who leave after viewing just one page. For blogs, high bounce rates aren’t necessarily negative—especially if visitors spend significant time on the page. A visitor might thoroughly read your comprehensive guide, get exactly what they needed, and leave satisfied without viewing other pages.
That said, unusually high bounce rates (above 85%) combined with low time on page (under 30 seconds) indicate content that’s failing to meet visitor expectations or technical issues affecting user experience.
Scroll Depth and Heatmap Analysis
Scroll depth tracking reveals how far down your posts visitors typically read. This granular engagement data helps identify where you’re losing reader attention.
Most heatmap tools show the percentage of visitors who reach each section of your content. Look for significant drop-offs—points where many readers stop scrolling. These often indicate content issues like walls of text, lack of visual breaks, or simply that readers got what they needed earlier in the post.
Pay special attention to whether visitors reach your calls-to-action. If your product recommendations or email signup forms appear below the point where 70% of readers have already left, you’re missing conversion opportunities. One clothing Shopify store increased conversions by 32% simply by moving their product showcases higher in their posts based on scroll data.
Heatmaps also identify engagement hotspots—the sections that capture the most attention or interaction. These often indicate topics of particular interest that could warrant expanded coverage in future posts.
Comments and Social Shares
While less common than in the past, comments provide valuable qualitative feedback. They reveal which topics spark discussion and what questions readers have after consuming your content.
Monitor comment sentiment and themes to identify content gaps and future post ideas. Questions in comments often highlight areas where your post could be expanded or where follow-up content would be valuable.
Social shares indicate content resonance beyond your immediate audience. Different content types tend to generate different sharing patterns—educational how-to content often performs well on Pinterest, while controversial opinion pieces might gain traction on Twitter.
Track not just share counts but the engagement those shares generate. A post shared by a smaller number of influential followers might drive more traffic than one with more shares among less engaged audiences.
Mobile vs. Desktop Performance
With mobile traffic dominating many Shopify stores, understanding device-specific performance is crucial for blog optimization.
Device-Specific Traffic Patterns
Compare traffic volume by device type to understand your audience’s browsing preferences. While mobile typically dominates overall web traffic (often 60-70%), the breakdown for your specific audience might differ based on your products and content.
Analyze differences in traffic sources by device. Social traffic often skews heavily mobile, while email newsletter referrals might show stronger desktop performance. These patterns inform how you should optimize content for different acquisition channels.
Understanding device preferences by audience segment can reveal important insights. For instance, one business supply Shopify store discovered their B2B audience primarily visited their blog from desktop during business hours, while their small business customers browsed primarily on mobile during evenings and weekends—leading to device-specific content strategies for each segment.
Engagement Differences Across Devices
Compare time on page between mobile and desktop users to identify potential content consumption issues. Mobile visitors typically spend 20-30% less time on content than desktop users due to context and user experience factors.
Scroll depth often varies significantly between devices. Mobile users might scroll further (as content is compressed into a narrower column) but actually read less content. Heatmap tools that segment by device help identify these differences.
Review bounce rate and pages per session metrics across devices to identify potential user experience issues. If your mobile bounce rate is substantially higher than desktop (>15% difference), it likely indicates mobile-specific usability problems that need addressing.
Optimizing for Device-Specific Performance
Mobile readability requires specific formatting considerations. Short paragraphs (2-3 sentences maximum), frequent subheadings, bulleted lists, and adequate font size (minimum 16px) all improve mobile reading experience.
Address device-specific user experience issues like navigation, popups, and form factors. Ensure your email signup forms and product recommendation widgets are easily usable on small touchscreens without frustrating users.
Consider creating device-optimized content formats for certain topics. One outdoor gear Shopify store created mobile-specific “quick guide” versions of their most popular hiking content—optimized for trail reference with minimal scrolling and bandwidth usage.
Conversion and Revenue Metrics
Traffic and engagement are meaningless if they don’t ultimately contribute to your business goals. Let’s examine how to measure your blog’s impact on sales and revenue.
Defining Blog Conversion Goals
Before measuring conversions, you need clear definitions of what actions constitute success for your blog.
Primary Conversion Actions
Product page visits from blog content represent the most direct path from content to commerce. Track the percentage of blog readers who click through to product pages as your primary content-to-commerce metric. Healthy rates typically range from 5-15% depending on content type and intent.
Email newsletter signups often serve as valuable micro-conversions. Blog readers who subscribe to your email list enter your owned marketing channel, where conversion rates typically exceed other channels. Track not just signup rates but the lifetime value of subscribers acquired through blog content.
Add-to-cart actions directly from blog posts (through embedded product widgets or links) demonstrate immediate purchase intent. This metric is particularly valuable for product-focused content like buying guides or product comparisons.
Completed purchases attributed to blog touchpoints represent the ultimate conversion. Track both last-click conversions (purchases made directly after reading a blog post) and assisted conversions (purchases where blog content appeared earlier in the buying journey).
Secondary Conversion Actions
Internal link clicks to related content indicate reader engagement and interest exploration. Track which types of internal links perform best—textual links within content, related post widgets, or category links.
Related product views show product discovery through content. This metric helps identify which blog topics most effectively introduce readers to your product catalog.
Account registrations from blog traffic indicate deeper engagement with your brand. Blog readers who create store accounts show higher intent and are more likely to become repeat customers.
Wishlist additions represent preserved purchase intent for future consideration. While not immediate sales, wishlist actions from blog content demonstrate product discovery and consideration—key steps in the purchasing journey.
Setting Up Goal Tracking in Analytics
Configure conversion goals in Google Analytics to systematically track these actions. In GA4, navigate to Admin → Events → Create Event to set up custom conversion events for blog-specific actions.
Create custom conversion events for blog-specific actions that don’t trigger standard e-commerce events. For example, you might track clicks on internal content links or engagement with interactive elements within blog posts.
Set up funnels to track conversion paths from blog entry points through to purchase completion. This visualization helps identify where potential customers drop off in the journey from content to checkout.
Consider implementing enhanced measurement using Google Tag Manager for more granular event tracking. This allows you to capture specific interactions like video plays, form submissions, or scroll depth milestones without modifying your site code.
Measuring Direct Revenue Impact
With conversion tracking in place, you can quantify your blog’s contribution to your store’s revenue.
Attributing Sales to Blog Content
Last-click attribution analysis shows purchases made immediately after blog interaction. This method credits the blog for conversions where it was the final touchpoint before purchase—typically undervaluing content’s role in the customer journey.
Assisted conversion reporting reveals blog influence on purchases even when it wasn’t the last touch. In Google Analytics, these reports show how often blog content appeared in conversion paths, even if it wasn’t the final interaction.
Multi-channel attribution models provide more nuanced views of content value. The “position-based” model (which gives 40% credit to first touch, 40% to last touch, and 20% distributed among middle touches) often provides a more accurate picture of blog contribution than default last-click models.
For the most accurate content attribution, consider implementing a custom attribution model that aligns with your typical customer journey. For example, if data shows your customers typically read 2-3 blog posts before making their first purchase, ensure your model properly values these early touchpoints.
Average Order Value from Blog Traffic
Compare the average order value (AOV) of blog-referred customers against your store average. Blog traffic often produces higher AOV than direct advertising channels because content-educated customers make more informed purchasing decisions.
Analyze the product mix from blog conversions to identify which product categories perform best when promoted through content. One home goods Shopify store discovered blog traffic had a 30% higher conversion rate for their premium product lines compared to other traffic sources.
Identify high-value blog content by segmenting AOV by entry page or content topic. This analysis often reveals surprising insights—sometimes detailed technical content outperforms overtly promotional posts in generating high-value orders.
Track these metrics over time to identify seasonal patterns or content types that consistently drive higher-value purchases. This information helps you strategically time your highest-potential content for maximum revenue impact.
Customer Lifetime Value of Blog-Acquired Customers
Track long-term value of blog-referred customers compared to other acquisition channels. This analysis often reveals that content-acquired customers have higher retention rates and lifetime value due to their education-first introduction to your brand.
Compare retention rates by acquisition channel to measure whether blog-acquired customers make repeat purchases more frequently than customers from other sources. One skincare Shopify store found that customers who discovered them through educational content had 23% higher retention rates than those acquired through ads.
Measure repeat purchase behavior to understand long-term value differences. Are blog-acquired customers more likely to explore different product categories? Do they respond better to email marketing? Answering these questions helps quantify the full value of content investment.
Consider implementing cohort analysis to track how customer behavior evolves over time based on acquisition source. This longitudinal view often shows that blog-acquired customers have more sustainable value than those from paid channels.
Calculating Blog ROI
With both cost and revenue data available, you can calculate the true return on your content investment.
Determining Blog Content Costs
Content creation expenses include writer fees, staff time, or agency costs directly related to producing blog posts. Be comprehensive in your accounting—include planning, writing, editing, and publishing time.
Design and multimedia costs cover imagery, custom graphics, videos, and other visual elements. While these enhance engagement, they also increase the cost basis for ROI calculations.
Promotion and distribution expenses include social media promotion costs, newsletter sends, or paid amplification of content. Some Shopify store owners mistakenly omit these when calculating content ROI.
For the most accurate calculations, include both direct costs (actual money spent) and opportunity costs (time you could have spent on other business activities). This comprehensive view gives you a true picture of your investment.
Measuring Total Blog-Generated Revenue
Direct sales attribution captures revenue from purchases where blog content received attribution credit. Pull this data from your Google Analytics e-commerce reports, segmented by blog traffic.
Assisted conversions value represents revenue influenced but not directly attributed to blog content. This figure is essential for understanding content’s full impact, as it often plays a supportive rather than closing role in the purchase journey.
Long-term customer value recognizes that blog-acquired customers often continue purchasing far beyond their initial transaction. Calculate the average 1-year or lifetime value of blog-acquired customers and include this in your revenue calculations.
For the most accurate measurement, implement a blended approach that incorporates all three revenue components. This prevents undervaluing your blog’s contribution to your store’s financial performance.
ROI Calculation Methods
The basic ROI formula (Revenue – Cost) ÷ Cost × 100 provides a simple percentage return figure. Apply this using your comprehensive cost and revenue figures for a baseline ROI measurement.
Time-adjusted ROI considerations acknowledge that content investment often yields returns over extended periods. Unlike ads that stop producing once spending ends, quality content can generate traffic and sales for years. Factor this “long tail” value into your calculations by projecting future returns based on current performance.
Compare blog ROI to other marketing channels to make informed budget allocation decisions. I’ve worked with many Shopify stores where blog content significantly outperformed paid social media or search ads in terms of ROI—but this was only discovered through systematic measurement.
For the most strategic perspective, calculate ROI at multiple levels: individual post ROI, topic cluster ROI, and overall blog ROI. This multi-level analysis helps you identify not just whether your blog is profitable, but which specific content investments yield the highest returns.
SEO Performance Metrics
For most Shopify blogs, organic search drives the majority of traffic and conversions. Let’s explore the key SEO metrics that reveal your content’s search performance.
Keyword Rankings and Visibility
Your blog’s position in search results directly influences its visibility and traffic potential.
Tracking Target Keyword Positions
Monitor ranking changes over time for your primary target keywords. Tools like Ahrefs, SEMrush, or Moz allow you to track positions at regular intervals. Positive momentum is often more important than absolute position—steady improvement indicates your content strategy is working.
Don’t focus exclusively on high-volume keywords. Some of your most valuable rankings may be for lower-volume but highly specific terms with stronger purchase intent. One automotive accessories Shopify store found that ranking first for several low-volume but specific queries (like “silicone car dashboard protectant for leather”) drove more conversions than their third-position ranking for a much higher volume term.
Compare rankings against competitors to benchmark your performance in your niche. This comparative analysis often reveals content gaps or opportunities where competitors are ranking for valuable terms you haven’t targeted yet.
Track not just your current rankings but the number of total keywords your blog ranks for. This “keyword universe” metric indicates your overall search visibility and typically correlates with organic traffic growth.
Search Impressions and Click-Through Rates
Google Search Console provides invaluable data on how your content performs in search results before users even click through to your site.
Analyze impression data to understand your content’s visibility in search results. Growing impressions indicate expanding search visibility, even if click-through rates remain stable.
Identify high-impression but low-click content—posts that appear in search results frequently but rarely get clicked. These represent opportunities for title and meta description optimization to improve click-through rates.
Focus on optimizing meta titles and descriptions to improve click-through rates. Even small improvements in CTR can significantly increase traffic without requiring new content creation or link building. A craft supplies Shopify store increased their blog traffic by 34% over three months simply by systematically optimizing their top 20 posts’ meta data for better CTR.
Compare your click-through rates against industry benchmarks. Average CTRs vary dramatically by position—approximately 28% for position one, dropping to about 15% for position two and 10% for position three.
Featured Snippets and Rich Results
Beyond standard rankings, enhanced search results can dramatically increase visibility and clicks.
Track which of your blog posts earn featured snippets—the highlighted answer boxes at the top of search results. These coveted positions can increase click-through rates by 2-3x and significantly enhance your perceived authority.
Optimize content for featured snippet acquisition by structuring information clearly. Format potential snippet content in paragraphs of 40-60 words that directly answer specific questions, in lists that solve “how-to” queries, or in tables that compare options.
Implement schema markup for rich results to enhance your search listings with ratings, reviews, breadcrumbs, or other supplementary information. These visual enhancements can significantly improve click-through rates by making your results stand out in the search results page.
Monitor which content formats most frequently earn enhanced results in your niche. For some Shopify stores, how-to content consistently earns featured snippets, while for others, list-based content or comparison posts perform better.
Backlink Performance
Backlinks remain a crucial ranking factor, making link acquisition an important metric for blog success.
Quantity and Quality of Backlinks
Monitor new backlink acquisition rates to track your content’s link-earning performance over time. A healthy blog typically shows steady link growth rather than static or declining link profiles.
Evaluate the domain authority (DA) or domain rating (DR) of linking sites to assess link quality. A few links from high-authority sites often provide more SEO value than many links from low-quality sources.
Analyze anchor text distribution to ensure natural link patterns. Over-optimized anchor text (too many links using exact keyword matches) can trigger search engine penalties, while a natural distribution of branded, URL, topical, and exact match anchors signals authentic link acquisition.
Review the relevance of linking sites to your niche. Links from topically relevant sites typically carry more weight than random links from unrelated sources. One outdoor equipment Shopify store found links from hiking blogs and outdoor magazines drove significantly more referral traffic and SEO benefit than links from general business sites.
Content-Specific Link Building Success
Identify which types of content naturally attract backlinks. Data-driven content, original research, comprehensive guides, and unique visuals typically earn links at higher rates than standard product-focused content.
Measure link-building campaign effectiveness by tracking outreach-to-link conversion rates. If you’re actively pursuing links through outreach, measure success rates and refine your approaches based on performance data.
Track referral traffic from backlinks to assess their value beyond SEO benefits. Some links drive significant direct traffic in addition to search ranking improvements. These dual-benefit links are particularly valuable and often indicate the most fruitful partnership opportunities.
Monitor link velocity—the rate at which individual pieces of content acquire links. This metric helps identify your most naturally link-worthy content formats and topics, informing future content creation.
Internal Linking Structure
Analyze your internal link distribution to ensure proper site architecture. Tools like Screaming Frog or Sitebulb visualize how link equity flows through your blog.
Identify orphaned content—blog posts with few or no incoming internal links. These posts typically underperform in search as they receive limited link equity from the rest of your site. One home decor Shopify store improved organic traffic by 47% by systematically identifying and fixing orphaned content issues.
Optimize internal link anchor text to provide clear topical signals. Unlike external links where over-optimization is a concern, internal links benefit from descriptive, keyword-rich anchor text that clearly communicates the destination page’s topic.
Review your most-linked internal pages to understand what content your site architecture prioritizes. Sometimes this analysis reveals that outdated or less valuable content receives disproportionate internal linking, while newer, more relevant content remains under-linked.
Technical SEO Metrics
Even exceptional content performs poorly if technical issues hamper search engine crawling, indexing, or user experience.
Page Speed and Core Web Vitals
Monitor loading performance using tools like Google PageSpeed Insights or GTmetrix. Since Google incorporates page speed into ranking algorithms, slow-loading blog pages face an uphill battle for visibility regardless of content quality.
Pay particular attention to mobile speed metrics, as they often lag behind desktop performance but represent the majority of users. A jewelry Shopify store improved mobile conversions by 28% after optimizing blog image sizes and implementing lazy loading.
Measure Core Web Vitals—Google’s specific user experience metrics that impact rankings. Focus on Largest Contentful Paint (LCP), First Input Delay (FID), and Cumulative Layout Shift (CLS). These metrics assess loading performance, interactivity, and visual stability respectively.
Address performance bottlenecks systematically based on test results. Common issues for Shopify blogs include oversized images, render-blocking resources, and excessive third-party scripts. Prioritize fixes based on impact, focusing first on issues that affect Core Web Vitals scores.
Mobile-Friendliness
Test responsive design effectiveness using Google’s Mobile-Friendly Test tool. Mobile usability issues directly impact both rankings and user experience since Google primarily uses mobile versions of pages for indexing and ranking.
Address common mobile usability issues like text too small to read, clickable elements too close together, or content wider than screen. These seemingly minor issues can significantly impact both user experience and search performance.
Optimize specifically for mobile search by prioritizing above-the-fold content quality and ensuring fast mobile page load times. Mobile users typically have less patience for slow-loading content and are more likely to abandon pages that don’t deliver value quickly.
Test user interactions on actual mobile devices rather than relying solely on emulators or responsive design tools. Real-world testing often reveals usability issues that technical tools miss.
Indexation Status
Track crawl stats and coverage in Google Search Console to ensure search engines can properly access your content. The Coverage report identifies indexation issues that prevent your content from appearing in search results.
Address indexation issues promptly. Common problems include accidental noindex directives, robots.txt blocks, or canonical tags pointing to alternative URLs. Even excellent content delivers zero value if search engines can’t index it.
Monitor XML sitemap performance to ensure Google is properly discovering and processing your new content. Check the sitemap report in Search Console to verify all your important blog content is included and successfully indexed.
Review index coverage regularly, particularly after significant content additions or site changes. One furniture Shopify store discovered that a template update had accidentally applied noindex tags to all blog category pages, dramatically reducing their organic visibility until the issue was identified and fixed.
Content Performance Analysis
With traffic, conversion, and SEO metrics in place, let’s examine how different types of content perform and how to optimize your content strategy.
Content Type Effectiveness
Different content formats serve different purposes and typically show distinct performance patterns.
Comparing Performance by Format
Analyze how different content formats perform across key metrics. How-to guides typically drive traffic and establish authority but may convert at lower rates than product-focused content. Case studies often have lower traffic but higher conversion rates and backlink acquisition.
Industry news and trendy topics can drive short-term traffic spikes but typically have shorter lifespan and lower long-term value than evergreen content. Measure both immediate performance and sustained value over time.
Product-focused vs. educational content typically show different strengths. Educational content usually drives more traffic and links, while product-focused content converts at higher rates but attracts less organic visibility. The ideal strategy typically includes both types in a complementary relationship.
Test new content formats based on performance data. If how-to guides consistently outperform other formats, experiment with variations like video how-tos, printable checklists, or step-by-step infographics to enhance their performance further.
Content Length and Depth Analysis
Examine the correlation between word count and engagement in your specific niche. While longer content (1,500+ words) typically ranks better for competitive terms, optimal length varies dramatically by topic and audience.
Compare performance of comprehensive vs. concise content across multiple metrics. Comprehensive guides often excel in traffic and backlinks but may see lower engagement rates than more focused pieces. A beauty Shopify store found their 4,000+ word ultimate guides earned 3x more links than shorter content but had 20% lower average read completion rates.
Determine optimal content depth for different topics based on performance data. Some subjects warrant extensive coverage while others perform better as concise, focused pieces. Let data rather than assumptions guide these decisions.
Consider testing content length variations on similar topics to identify the sweet spot for your audience. This controlled testing often reveals surprising insights about reader preferences that contradict general best practices.
Multimedia Impact Assessment
Measure engagement differences between text-only posts and those incorporating videos. Video content typically increases time on page by 2-3x but requires significantly higher production investment.
Assess the performance impact of custom graphics and visualizations. Posts with custom illustrations, infographics, or data visualizations typically earn more links and social shares than text-only content. One fitness equipment Shopify store saw a 3x increase in social sharing after implementing custom exercise illustration graphics in their workout blog posts.
Test interactive content effectiveness if your platform supports it. Calculators, quizzes, and other interactive elements typically show strong engagement metrics and higher conversion rates but come with higher development costs.
Measure the ROI of different multimedia investments to make informed decisions about resource allocation. Some visual elements dramatically improve performance, while others may not justify their creation cost.
Topic and Keyword Performance
Beyond format, the subjects you cover significantly impact performance.
Identifying High-Performing Topics
Categorize content by topic clusters to identify patterns in performance. Group related posts together and analyze aggregate metrics to identify your highest-performing subject areas.
Analyze performance patterns by subject to inform future content planning. If sustainability-focused posts consistently outperform other topics in both traffic and conversion metrics, this insight should influence your content calendar.
Discover audience topic preferences by examining engagement metrics across subject areas. Sometimes the topics you assume would resonate most strongly aren’t those that actually engage your audience. Let data challenge your assumptions.
Balance audience interest with business relevance when prioritizing topics. The ideal content sits at the intersection of high audience interest and strong business relevance to your products.
Keyword Effectiveness Analysis
Compare traffic by targeted keywords to identify which search terms bring the most visitors. Beyond volume, examine which keywords bring the most engaged traffic based on metrics like time on page and pages per session.
Identify high-conversion keywords that may have lower volume but superior business value. A kitchen supply Shopify store discovered that specific terms like “best carbon steel wok for electric stove” converted at 4x their site average despite modest search volume.
Discover new keyword opportunities through Search Console data, looking for queries where you rank on page two or have impressions but low click rates. These often represent low-hanging fruit for content optimization.
Track keyword ranking volatility to identify search terms where your position is unstable. Volatile rankings often indicate content that partially meets search intent but needs optimization to secure stable positions.
Seasonal and Trend Analysis
Identify cyclical content performance to plan timely updates and promotion. Many topics show predictable seasonal patterns that should inform both creation and refreshing schedules.
Capitalize on trending topics that align with your niche by monitoring search trend data and social listening. Timely content on emerging trends can drive significant short-term traffic and capture new audience segments.
Plan your content calendar based on historical seasonal patterns, scheduling creation and updates to align with peak interest periods. One holiday decoration Shopify store increased Q4 traffic by 73% by analyzing previous years’ seasonal performance and preparing optimized content two months before peak search periods.
Balance evergreen and seasonal content for consistent performance throughout the year. While seasonal content drives traffic spikes, evergreen content provides stable traffic foundations.
Content Decay and Refresh Strategy
Even successful content eventually loses effectiveness without regular maintenance.
Identifying Declining Content
Monitor traffic trends for older content to identify posts experiencing decay. Look for steady traffic declines over 3-6 month periods rather than normal fluctuations.
Detect ranking drops for key posts using position tracking tools. Significant ranking declines (3+ positions) often indicate content that’s becoming outdated or being outperformed by newer competitor content.
Analyze engagement changes over time to identify content that’s becoming less relevant or effective. Declining time on page or increasing bounce rates often precede traffic drops and signal needed updates.
Prioritize refresh efforts based on potential value recovery. Focus first on previously high-performing content that has declined rather than posts that never performed well.
Content Refresh Impact Measurement
Compare before and after performance across key metrics when updating content. Track changes in traffic, rankings, engagement, and conversions to quantify the impact of your refresh efforts.
Track ranking recoveries after updates to determine how effectively your refreshes resolve search position declines. Successful refreshes typically show ranking improvements within 2-4 weeks.
Measure engagement improvements following content updates. Besides traffic recovery, refreshed content should show improved user signals like longer time on page, lower bounce rates, and higher conversion rates.
Calculate the ROI of content refreshes compared to creating new content. Most Shopify stores find that updating high-potential existing content yields faster and higher returns than equivalent investment in new content creation.
Evergreen vs. Time-Sensitive Content Analysis
Identify truly evergreen content by analyzing performance stability over extended periods. Genuine evergreen content maintains relatively stable traffic with seasonal variations but without significant decline trends.
Compare performance longevity by content type to inform your content mix strategy. How-to guides, comprehensive resources, and educational content typically maintain value longer than news, trends, or seasonal content.
Perform ROI comparison between content approaches, measuring both short-term impact and long-term value. Most successful Shopify blogs find that a mix of approximately 70-80% evergreen content supplemented with 20-30% timely content delivers optimal results.
Develop distinct maintenance schedules based on content type. Evergreen cornerstone content might need comprehensive updates 2-3 times yearly, while seasonal content requires annual refreshes before relevant periods.
Implementing a Data-Driven Blog Strategy
With comprehensive measurement in place, let’s explore how to translate these insights into strategic action.
Creating Performance Dashboards
Proper data visualization and organization makes insights accessible and actionable.
Building Custom Reporting Dashboards
Select key metrics for regular monitoring based on your specific business goals. While certain metrics (traffic, conversions, revenue) are universally relevant, prioritize those that align with your particular objectives.
Create visualizations that highlight trends and patterns rather than just displaying numbers. Line charts for trend identification, bar charts for comparisons, and heatmaps for pattern recognition each serve specific analytical purposes.
Set up automated reporting to ensure consistent monitoring without manual effort. Tools like Google Data Studio, Databox, or even custom Google Sheets can pull data automatically and generate regular reports.
Design dashboards that combine metrics from multiple sources for comprehensive views. Integrated dashboards that combine Shopify, Google Analytics, and Search Console data provide more actionable insights than siloed reports.
Setting Performance Benchmarks
Establish baseline metrics from your historical data before setting growth targets. Without this foundation, performance goals may be either unrealistically ambitious or insufficiently challenging.
Create realistic growth targets based on historical performance and resource investment. For established blogs, 20-30% year-over-year organic traffic growth represents healthy performance, while newer blogs might target 10-15% month-over-month growth.
Develop competitive benchmarks by analyzing comparable stores in your niche. Tools like SEMrush or Ahrefs allow you to estimate competitor metrics like traffic, keywords, and backlinks to establish realistic competitive targets.
Set tiered goals that acknowledge the progression of blog maturity. A new blog might focus primarily on content production and traffic growth, while a mature blog should emphasize conversion optimization and revenue metrics.
Sharing Insights with Stakeholders
Create executive summaries that translate complex data into business impact. Focus on bottom-line metrics like revenue, ROI, and customer acquisition costs rather than vanity metrics when communicating with business stakeholders.
Visualize ROI clearly for decision-makers to justify continued or increased content investment. Charts comparing content marketing ROI to other channels often effectively communicate blog value.
Connect blog performance to broader business objectives like brand awareness, customer education, and loyalty. This connection helps stakeholders understand content’s role beyond direct conversion metrics.
Customize reporting for different audiences within your organization. Marketing team members might need detailed tactical insights, while store owners or executives require high-level strategic metrics.
Testing and Optimization Framework
Systematic testing and improvement processes turn insights into performance gains.
A/B Testing Blog Elements
Test headline formulations to improve click-through rates from search and social channels. Even small CTR improvements can significantly increase traffic without requiring new content creation.
Experiment with content formats like list posts vs. ultimate guides, or image-heavy vs. text-focused layouts. These format tests often reveal audience preferences that contradict conventional wisdom for your specific niche.
Optimize call-to-action placement and design based on scroll depth and click data. Heatmap tools can reveal the ideal positions for product recommendations, email signups, and other conversion elements.
Implement controlled testing by changing only one element at a time and measuring impact over sufficient time periods. Maintain test control by using duplicate posts with single variables changed rather than before/after testing that might be affected by timing factors.
Content Optimization Process
Prioritize content for optimization based on potential impact. Focus on posts with high traffic but low conversion rates, or those ranking on page two of search results that could be moved to page one with targeted improvements.
Implement systematic improvements following a consistent checklist. Develop standard optimization protocols covering on-page SEO elements, readability enhancements, multimedia additions, and conversion element improvements.
Measure optimization impact by comparing pre- and post-update performance across relevant metrics. Establish minimum testing periods (typically 2-4 weeks) before drawing conclusions about optimization effectiveness.
Document successful optimization tactics to build an internal playbook. When certain improvements consistently deliver results (like adding original graphics or reorganizing content structure), these tactics should be systematized and applied across your content.
Audience Segmentation and Personalization
Create content specifically designed for different audience segments based on performance data. If analytics show distinct visitor groups with different behaviors, develop targeted content for each major segment.
Measure segment-specific performance to refine your targeting approach. Track how different audience segments engage with various content types and topics to inform increasingly targeted creation.
Implement dynamic content recommendations based on user behavior data. Tools like recommended post widgets that suggest content based on browsing history or purchase behavior typically increase pages per session and time on site.
Test personalization elements like product recommendations within content based on visitor behavior. Personalized elements typically show higher conversion rates than generic recommendations.
Scaling What Works
Once you’ve identified high-performing approaches, systematically expand their implementation.
Content Replication Strategy
Identify patterns in successful content by analyzing your top-performing posts. Look beyond surface topics to identify structural elements, writing styles, or content mechanisms that drive engagement and conversion.
Create templates based on high performers to streamline production of similar content. Templated approaches ensure consistent implementation of successful elements while reducing creation time.
Adapt winning formulas to new topics by maintaining structural and stylistic elements while covering fresh subject matter. This approach leverages proven formats while expanding your content coverage.
Develop modular content components that can be combined in different ways. Elements like comparison tables, step-by-step guides, or expert commentary sections that consistently perform well can be standardized and incorporated across multiple posts.
Resource Allocation Based on Performance
Invest more in high-ROI content types based on historical performance data. If long-form guides consistently outperform other formats in traffic, engagement, and conversion metrics, prioritize their creation in your content calendar.
Reduce effort on underperforming formats or topics unless they serve specific strategic purposes. Be willing to sunset content approaches that data shows aren’t delivering adequate returns.
Balance short-term wins with long-term goals in your resource allocation. Some content may take longer to mature but deliver superior long-term value. Educational cornerstone content, for instance, typically takes longer to gain traction but often delivers more sustainable traffic than trendy, time-sensitive pieces.
Implement portfolio thinking by maintaining a mix of content investments with different risk/reward profiles. High-certainty, moderate-return content should form your foundation, supplemented by higher-risk, potentially higher-reward experimental content.
Continuous Learning and Improvement
Establish regular performance reviews with a consistent schedule and framework. Monthly tactical reviews and quarterly strategic reviews provide both short-term optimization opportunities and longer-term strategic direction.
Create feedback loops for content creators by sharing performance data and insights. This connection between creation and results fosters data-informed creative decisions rather than purely intuitive ones.
Stay current with analytics capabilities and emerging measurement approaches. As platforms evolve and new tools emerge, regularly reassess your measurement framework to incorporate improved methodologies.
Foster a culture of experimentation and data-driven decision making by celebrating insights rather than just successes. Teams that value learning from both wins and losses typically outperform those focused solely on victories.
References
- Shopify Help Center. (2025). “Using Analytics and Reports.” https://help.shopify.com/en/manual/reports-and-analytics
- Google Analytics Academy. (2024). “E-commerce Analytics for Shopify.” https://analytics.google.com/analytics/academy/
- Benchmarkemail. (2023). “10 Blog Metrics You Should be Using to Track Success.” https://www.benchmarkemail.com/blog/blog-metrics-to-track-success/
- First Pier. (2023). “Ultimate Guide to Shopify Blog Marketing Mastery.” https://www.firstpier.com/resources/shopify-blog-marketing
- Shopify. (2024). “Ecommerce Performance Analysis: Metrics and KPIs to Measure.” https://www.shopify.com/enterprise/blog/ecommerce-data-analysis
Ready to supercharge your Shopify store’s sales with data-driven campaigns and optimized discount strategies? Growth Suite is a powerful Shopify app that leverages AI to analyze visitor behavior and deliver perfectly timed discount codes. Its robust analytics engine tracks your store’s performance and identifies optimization opportunities, while its campaign engine creates personalized, time-limited offers that dramatically increase conversions. Install Growth Suite with a single click today and watch your revenue grow!