![]()
Every successful Shopify store has one thing in common: they make decisions based on data, not guesswork. But here’s the challenge—with so much information flowing through your store every day, how do you transform raw numbers into actionable insights that actually drive growth?
The answer lies in building a comprehensive reporting strategy that works for your specific business stage and goals. Whether you’re launching your first store or scaling to seven figures, the right reporting approach can be the difference between flying blind and confidently steering your business toward success.
In this guide, you’ll discover how to create a reporting framework that evolves with your store, uncover the metrics that matter most at each growth stage, and learn practical strategies to turn data into decisions that boost your bottom line.
Why Reporting Matters for Shopify Success
Think about it this way: would you drive cross-country without a map or GPS? Of course not. Yet many Shopify store owners make critical business decisions without the guidance that proper reporting provides.
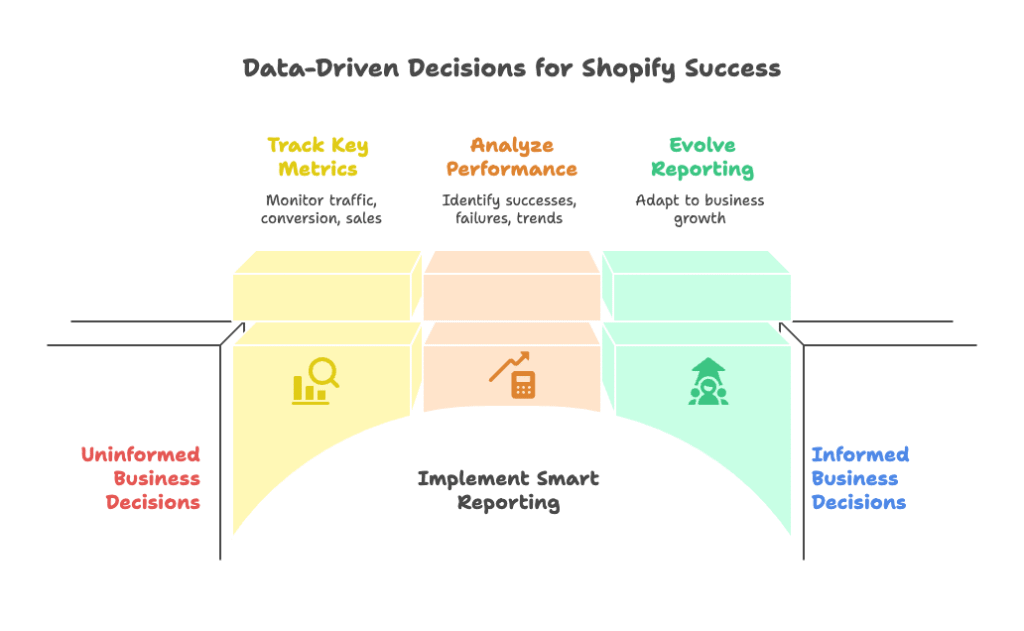
Data-driven decision making isn’t just a buzzword—it’s the foundation of sustainable e-commerce growth. When you base your choices on solid reporting rather than hunches, you eliminate costly mistakes and identify opportunities that intuition alone might miss.
Driving Informed Decision-Making
Good reporting transforms your Shopify store from a black box into a transparent operation where every decision is backed by evidence. Instead of wondering why sales dipped last month, you’ll know exactly which traffic sources underperformed, which products struggled, and where customers dropped off in your funnel.
This clarity extends beyond just fixing problems. Smart reporting reveals what’s working exceptionally well, allowing you to double down on successful strategies. Maybe your email campaigns drive twice the revenue on Tuesdays, or perhaps customers who view three specific product pages convert at 40% higher rates.
These insights become the backbone of your marketing strategy, inventory decisions, and customer experience improvements. But here’s the key—your reporting needs must evolve as your business grows.
Aligning Reporting With Store Goals
A starter store launching its first product has vastly different reporting needs than an established brand managing multiple sales channels. Your reporting strategy should match your current business stage and objectives.
Early-stage stores need to focus on fundamental metrics like traffic sources, conversion rates, and basic sales data. As you mature, your reporting becomes more sophisticated, incorporating customer lifetime value, channel attribution, and advanced behavioral analytics.
This alignment ensures you’re not drowning in irrelevant data or missing critical insights that could accelerate your growth.
Foundational Concepts: Reporting Essentials for All Shopify Stores
Before diving into advanced strategies, let’s establish the core metrics that every Shopify store should monitor, regardless of size or sophistication level.
Key E-Commerce Metrics and Shopify KPIs
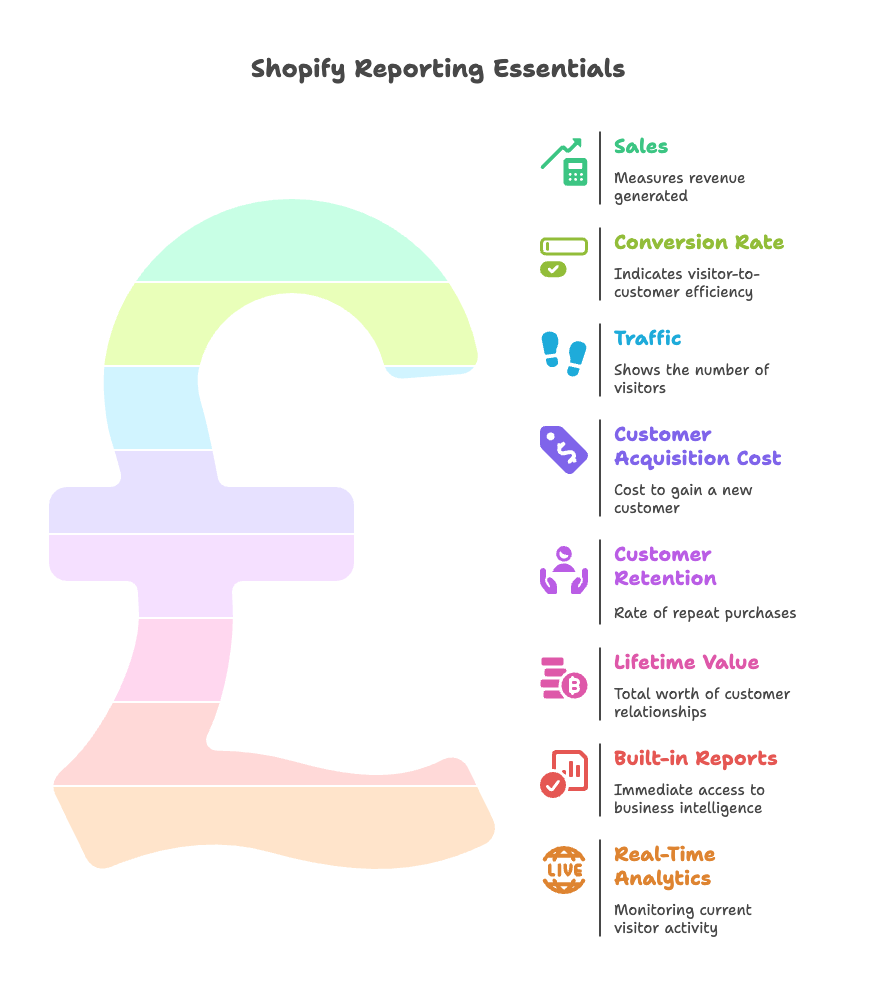
Your reporting foundation rests on understanding five critical metric categories. Master these, and you’ll have the building blocks for more advanced analysis.
Sales, Conversion Rate, and Traffic form the holy trinity of e-commerce metrics. Sales revenue tells you how much money you’re making, but without context, it’s just a number. Conversion rate reveals how effectively you turn visitors into customers, while traffic metrics show whether you’re reaching enough potential buyers.
Here’s what makes Shopify reporting powerful: these metrics are interconnected. A 20% increase in traffic with a stable conversion rate means proportional revenue growth. But if traffic rises while conversions drop, you know there’s a quality issue with your new visitors or a problem with your site experience.
Customer Acquisition, Retention, and Lifetime Value metrics tell the deeper story of your business health. Customer Acquisition Cost (CAC) shows how much you spend to gain each new customer. Repeat purchase rates indicate customer satisfaction and product-market fit. Lifetime Value (LTV) reveals the total worth of your customer relationships.
The magic happens when you analyze these metrics together. If your LTV is three times your CAC, you have a sustainable growth model. If the ratio is closer to 1:1, you need to either reduce acquisition costs or increase customer value.
Shopify Reporting Features: Overview
Shopify’s built-in reporting capabilities are more robust than many store owners realize. The platform provides comprehensive dashboards that cover everything from basic sales data to sophisticated conversion funnel analysis.
Built-in Reports and Dashboards give you immediate access to critical business intelligence. The Overview dashboard provides a high-level snapshot of your store’s performance, while specialized reports dive deep into product analytics, conversion funnels, and inventory management.
What’s particularly valuable is how Shopify customizes available reports based on your plan level. Starter plan users get essential reports, while Advanced plan subscribers access detailed profit analysis and custom report builders.
Real-Time Analytics and Monitoring capabilities ensure you never miss important trends or opportunities. Shopify’s Live View feature shows current visitor activity, while event tracking captures every interaction that might influence a purchase decision.
The drag-and-drop dashboard customization means you can prioritize the metrics that matter most to your business stage and goals.
Segmenting Reporting Strategy: Tailoring Insights to Your Growth Stage
One size definitely doesn’t fit all when it comes to Shopify reporting. Your focus should shift as your business evolves, and your reporting strategy needs to reflect these changing priorities.
Starter & Beginner Stores: Tracking Early Growth
If you’re just launching or in your first year of operations, simplicity is your friend. You need clear, actionable insights without overwhelming complexity.
Acquisition Reports: Sessions, Referrers, Locations should be your starting point. These reports answer fundamental questions: Where are your visitors coming from? Which marketing channels drive the most traffic? Are you reaching your target geographic markets?
Focus on the traffic sources that convert best, not just those that drive the most visitors. A social media channel that sends 1,000 visitors with a 0.5% conversion rate is less valuable than an email campaign that brings 100 visitors with a 5% conversion rate.
Use this data to refine your early marketing efforts and budget allocation. Double down on channels that work while cutting spend on underperformers.
Product & Order Reports for Inventory Management prevent costly mistakes that can sink early-stage businesses. Month-end snapshots show which products are moving and which are sitting stagnant.
Pay attention to sell-through rates and implement simple ABC analysis—categorize products as A (high performers), B (moderate performers), or C (underperformers). This framework guides inventory decisions and helps you avoid cash flow problems from dead stock.
Intermediate Stores: Optimizing for Conversion and Scale
Once you’ve achieved initial traction and consistent sales, your reporting focus shifts from survival to optimization. You’re no longer just trying to make sales—you’re trying to make them more efficiently.
Behavior & Checkout Analysis becomes crucial at this stage. You need to understand not just who’s buying, but why others aren’t. Shopify’s behavior reports reveal site speed issues, popular product combinations, and landing page performance.
Cart analysis reports are particularly valuable for identifying upsell and cross-sell opportunities. When you see that customers frequently purchase specific product combinations, you can create bundles or automated recommendations that increase average order value.
Monitor checkout drop-off points religiously. Every percentage point improvement in checkout completion can significantly impact your bottom line.
Customer Cohort & Repeat Rate Reporting helps you transition from a transaction-focused to a relationship-focused business model. Segment customers by lifetime value, purchase frequency, and risk of churn.
Create custom retail sales reports that track repeat purchase behavior over time. This data informs customer retention strategies and helps you identify your most valuable customer segments for targeted marketing.
Advanced Stores: Customization and Strategic Benchmarking
High-performing stores need sophisticated reporting that supports strategic decision-making and competitive positioning.
Financial, Marketing, and Custom Reports provide the detailed insights necessary for advanced optimization. Profit margin analysis reveals which products and channels generate the most profitable sales, not just the highest revenue.
Marketing attribution reports become essential for sophisticated ad spend allocation. You need to understand both first-touch and last-touch attribution, as well as the role of each touchpoint in the customer journey.
This is where ShopifyQL and external integrations shine, allowing you to create custom reports that match your specific business model and KPIs.
Benchmarking Against Peers and Industry Standards ensures you maintain competitive performance. Shopify provides aggregated platform benchmarks that show how your metrics compare to similar stores.
Use these comparisons to identify areas where you’re leading the pack and opportunities where you’re falling behind. This intelligence guides strategic planning and helps you set realistic but ambitious goals.
Building Out a Reporting Framework: Types of Reports & Data Sources
Now that you understand what to focus on at each growth stage, let’s explore how to actually build your reporting framework using Shopify’s extensive capabilities.
Core Shopify Report Types
Shopify organizes its reporting into nine core categories, each serving specific business intelligence needs.
Acquisition, Behavior, Customer, Inventory, Marketing, Order, Profit, Retail Sales, and Sales Reports form the complete picture of your business performance. The key is knowing which reports matter most for your current situation.
Acquisition reports focus on traffic sources and visitor behavior before purchase. Behavior reports analyze on-site activity and conversion paths. Customer reports reveal purchasing patterns and loyalty metrics.
Inventory reports prevent stockouts and overstock situations. Marketing reports track campaign performance across channels. Order reports provide transaction-level details for fulfillment and analysis.
Profit reports (available on higher-tier plans) show true profitability after accounting for product costs. Retail sales reports are crucial for multi-channel businesses. Sales reports provide the foundational revenue metrics every business needs.
Select the reports that align with your growth stage priorities, but don’t try to monitor everything at once. Focus beats comprehensiveness every time.
Custom Report Creation and Editing
Shopify’s custom reporting capabilities let you tailor analysis to your specific business needs and questions.
Templates, Filters, and Custom Columns provide the flexibility to create exactly the reports you need. Start with Shopify’s templates, then modify them using filters to focus on specific time periods, product categories, or customer segments.
Custom columns let you add calculated fields or additional data points that matter to your business. For example, you might create a column that shows profit margin percentage alongside revenue figures.
When building custom reports, start simple and add complexity gradually. A report that’s too complex to understand quickly won’t get used regularly.
Exporting and Integrating Shopify Data extends your reporting capabilities beyond what’s available in the dashboard. Export data to CSV for deeper analysis in Excel or Google Sheets, or use Shopify’s API to feed data into advanced analytics platforms.
Set up automated exports for reports you review regularly. This saves time and ensures consistency in your analysis routine.
Supplementing Shopify Data: Apps and Integrations
While Shopify’s native reporting is comprehensive, specialized apps can provide additional insights and functionality.
Reporting Apps: Overview and Selection should be based on specific gaps in your current capabilities. Apps like Mipler offer advanced profit analysis, while Report Pundit provides sophisticated customer segmentation tools.
Data Export Reports specializes in automated data exports, BeProfit focuses on profit tracking, and Report Toaster offers custom dashboard creation. Each serves specific needs that might not be covered by standard Shopify reports.
Choose apps based on your actual requirements, not impressive feature lists. The best reporting app is the one that solves a specific problem you’re currently facing.
Analysis and Action: Turning Reports into Strategic Decisions
Reports are only valuable if they lead to action. The most sophisticated analytics in the world won’t improve your business unless you consistently act on the insights they provide.
Setting Up Goals and Reporting Cadence
Establish clear, measurable goals that align with your business stage and growth objectives.
Establishing Relevant KPIs by Store Stage ensures you’re focusing on metrics that actually matter for your current situation.
Starter stores should focus on fundamental metrics: total sales, conversion rate, and abandoned cart recovery. These basics establish whether your business model is viable.
Intermediate stores need to track ROI metrics, conversion funnel drop-offs, and repeat purchase rates. These insights guide optimization efforts and resource allocation.
Advanced stores require sophisticated metrics like customer lifetime value ratios, channel attribution models, and profit margins by customer segment. These support strategic planning and competitive positioning.
Scheduling Reports and Data Reviews creates consistency and ensures important insights don’t get missed. Establish daily, weekly, and monthly review cycles that match your business rhythm.
Daily reviews should focus on immediate action items—traffic anomalies, conversion issues, or inventory alerts. Weekly reviews examine trends and campaign performance. Monthly reviews support strategic planning and goal assessment.
Automate alerts for critical metrics to catch problems early. Set up notifications for significant traffic drops, conversion rate changes, or inventory issues.
Diagnosing Problems and Spotting Opportunities
Effective reporting helps you identify both problems that need fixing and opportunities worth pursuing.
Funnel Analysis and Drop-Off Detection pinpoints exactly where you’re losing potential customers. Shopify’s funnel visualization shows the percentage of visitors who progress through each stage of the buying process.
Focus on the biggest drop-off points first. If 50% of visitors who add items to their cart don’t complete checkout, that’s a bigger opportunity than optimizing a page that’s already converting well.
Track the impact of your optimization efforts by comparing funnel performance before and after changes. This validates whether your improvements actually work.
Product Performance and Inventory Optimization helps you maximize revenue from your existing catalog. Identify your conversion champions—products that consistently turn browsers into buyers—and your laggards that consume attention without generating sales.
Use this intelligence to guide inventory decisions, marketing focus, and product development priorities. Push more traffic to high-converting products while improving or discontinuing poor performers.
Monitor trends in product performance to catch changes early. A previously strong seller that’s declining might indicate changing customer preferences or increased competition.
Marketing Campaign & Channel Attribution reveals which marketing efforts truly drive profitable sales. Look beyond last-click attribution to understand the full customer journey.
Track both immediate campaign ROI and longer-term customer value. A campaign that breaks even on first purchase might be highly profitable when repeat purchases are considered.
Use attribution insights to optimize budget allocation across channels and campaigns. Shift spending toward activities that drive the highest lifetime customer value, not just immediate conversions.
Benchmarking and Continuous Improvement
Your reporting strategy should evolve as your business grows and market conditions change.
Comparing Current Performance to Benchmarks provides context for your results. Shopify’s aggregated benchmarks show how your metrics compare to similar stores, while industry reports provide broader competitive context.
Use benchmark comparisons to set realistic but ambitious goals. If similar stores achieve 3.2% conversion rates and you’re at 2.1%, you know improvement is possible and worthwhile.
Remember that benchmarks are starting points, not destinations. Your goal should be to exceed average performance, not just match it.
Continuous Enhancement of Strategy ensures your reporting remains relevant and actionable as your business evolves. Regularly review which reports you actually use and which provide little value.
Streamline your reporting by eliminating metrics that don’t influence decisions. Focus on a core set of KPIs that directly support your current business objectives.
Leverage automation tools and third-party integrations to reduce manual reporting work. The time saved can be invested in analysis and action rather than data compilation.
Advanced Reporting Strategies: Real-Time Data, Personalization, and AI
Once you’ve mastered the fundamentals, advanced reporting techniques can provide competitive advantages and deeper insights.
Real-Time Analytics and Automated Alerts
Real-time data enables immediate responses to changing conditions and emerging opportunities.
Implementing Live View and Custom Dashboards keeps you connected to your store’s pulse. Monitor traffic spikes from successful social media posts, track the immediate impact of promotional campaigns, and spot technical issues before they significantly impact sales.
Set up custom dashboards that display the metrics most crucial for your daily decision-making. Prioritize actionable data over impressive-looking vanity metrics.
Use automated alerts to notify you of significant changes in key metrics. This ensures you can respond quickly to both problems and opportunities without constantly monitoring dashboards.
Personalized Reporting & Behavioral Intelligence
Advanced reporting goes beyond aggregate metrics to understand individual customer behavior and preferences.
Segmentation Based on Customer Behavior allows for more targeted and effective marketing. Create segments based on engagement levels, device preferences, purchase recency, and other behavioral indicators.
Track real-time visitor behavior to identify high-intent shoppers who might benefit from targeted offers or assistance. This behavioral intelligence supports personalized experiences that increase conversion rates.
Use behavioral data to trigger automated campaigns and offers. Visitors who spend significant time on product pages but don’t purchase might respond well to targeted discounts or follow-up emails.
AI and Predictive Analytics in Shopify Reporting can identify patterns and opportunities that human analysis might miss. Leverage AI-powered apps for advanced funnel analysis, product performance prediction, and customer lifetime value modeling.
Automated report generation saves time while ensuring consistent analysis. Focus your human attention on strategic interpretation and decision-making rather than data compilation.
For larger stores, AI can process vast amounts of data to surface actionable insights that would be impossible to identify manually.
Case Studies and Real-World Applications
Theory is valuable, but real-world results prove the power of comprehensive reporting strategies. These case studies demonstrate how proper reporting translates into measurable business improvements.
Success Stories with Growth Suite and Shopify Reporting
Several Shopify stores have achieved significant improvements by implementing comprehensive reporting strategies combined with advanced optimization tools.
Gelin Diamond increased their conversion rate by 5.3% through report-driven interventions. By analyzing their funnel reports, they identified specific drop-off points and implemented targeted solutions that directly addressed customer behavior patterns.
The key was using behavioral analytics to understand why visitors were abandoning their carts, then creating personalized interventions that addressed those specific concerns.
Golden Gilt reduced cart abandonment by 4.9% through analytics integration that revealed customer hesitation patterns. Their reporting showed that certain visitor segments needed different types of encouragement to complete purchases.
By segmenting their audience based on behavioral data and applying targeted retention strategies, they recovered sales that would have otherwise been lost.
My Great Canvas achieved a 5.7% conversion lift through funnel report optimization that identified and resolved checkout friction points. Their detailed analysis revealed that small changes in their checkout process could have outsized impacts on completion rates.
These results demonstrate how comprehensive reporting enables data-driven optimization that delivers measurable business results.
Industry Benchmarks and Lessons Learned
Broader industry data provides additional validation for the importance of comprehensive reporting strategies.
Revenue and AOV Growth from unified POS and integrated reporting shows the power of complete data visibility. Tigerly achieved a 20% revenue increase by implementing comprehensive reporting that revealed previously hidden opportunities for upselling and cross-selling.
The integration of online and offline data provided insights that neither channel could deliver alone, resulting in more effective marketing and improved customer experiences.
Real-World Impact of reporting on streamlining operations and scaling retail demonstrates that comprehensive analytics support both revenue growth and operational efficiency. Stores with sophisticated reporting typically achieve faster growth with lower operational overhead.
The lesson is clear: investment in comprehensive reporting pays dividends across multiple areas of business performance.
Summary and Next Steps: Implementing Your Comprehensive Reporting Strategy
Building a comprehensive reporting strategy isn’t about implementing every possible metric and dashboard. It’s about creating a framework that provides the right insights at the right time to support better decision-making.
Making Reporting Actionable for Every Store
The key to successful reporting lies in alignment with your current business stage and objectives.
Start by identifying stage-specific goals and KPIs that matter for your current situation. Don’t try to track everything—focus on metrics that directly influence decisions you need to make.
Set up routine reporting and analysis cycles that fit your business rhythm. Consistency beats perfection when it comes to extracting value from your data.
Use built-in reports, custom analysis, and specialized apps strategically to fill specific gaps in your understanding. The best reporting setup is the one that provides maximum insight with minimum complexity.
Most importantly, continuously adapt your strategy as your business and data needs evolve. Your reporting framework should grow and change alongside your store.
Practical Next Steps
Implementation starts with understanding your current situation and identifying the biggest opportunities for improvement.
Audit your current reporting setup and access. What reports do you currently review? Which ones actually influence your decisions? What questions do you wish you could answer but currently can’t?
Implement missing dashboards, reports, and recommended apps based on your growth stage and specific needs. Start with the fundamentals before adding complexity.
Regularly review, benchmark, and optimize your reporting strategy for results. The most sophisticated analytics are worthless if they don’t lead to better business outcomes.
Remember, the goal isn’t perfect reporting—it’s better decision-making that drives sustainable growth for your Shopify store.
References
- Shopify Analytics and Reporting Dashboards. Shopify. https://www.shopify.com/analytics
- The Beginner’s Guide to Using Shopify Reports and Analytics. Shopify Blog, 2022. https://www.shopify.com/blog/analyzing-shopify-reports
- The Ultimate Guide to Shopify Reports (2025). Saras Analytics. https://www.sarasanalytics.com/blog/shopify-reports
- Growth Suite Product & Reporting Features. Growth Suite, 2025. https://www.growthsuite.net/features/data-reporting
- Shopify API, libraries, and tools. Shopify. https://shopify.dev/docs/api
Ready to supercharge your Shopify store’s performance with data-driven insights and perfectly optimized conversion strategies? Growth Suite is a Shopify app that combines advanced visitor behavior tracking with intelligent reporting to help you boost sales and revenue. Our comprehensive analytics work alongside Shopify’s native reporting to provide deeper insights into customer behavior, while our smart discount optimization ensures you’re maximizing conversions without wasting money on unnecessary discounts. Install Growth Suite with a single click and start seeing results—your reporting strategy just got a powerful upgrade!