![]()

Picture this: It’s Monday morning, and you’re staring at your Shopify dashboard wondering what happened over the weekend. Sales were up, but which products drove the spike? Traffic looked good, but where did those visitors come from? Without a solid reporting schedule, you’re flying blind.
Here’s the thing—successful Shopify stores don’t just track numbers. They create rhythms. Daily pulses that catch immediate opportunities. Weekly check-ups that spot emerging trends. Monthly deep dives that reveal the bigger picture.
In this guide, you’ll discover how to build a reporting schedule that actually moves your business forward. We’ll cover the exact metrics to track at each interval, show you how to automate the process, and share a real case study of a store that transformed their decision-making speed. By the end, you’ll have a complete blueprint for staying ahead of your data instead of chasing it.
Establishing Your Reporting Framework
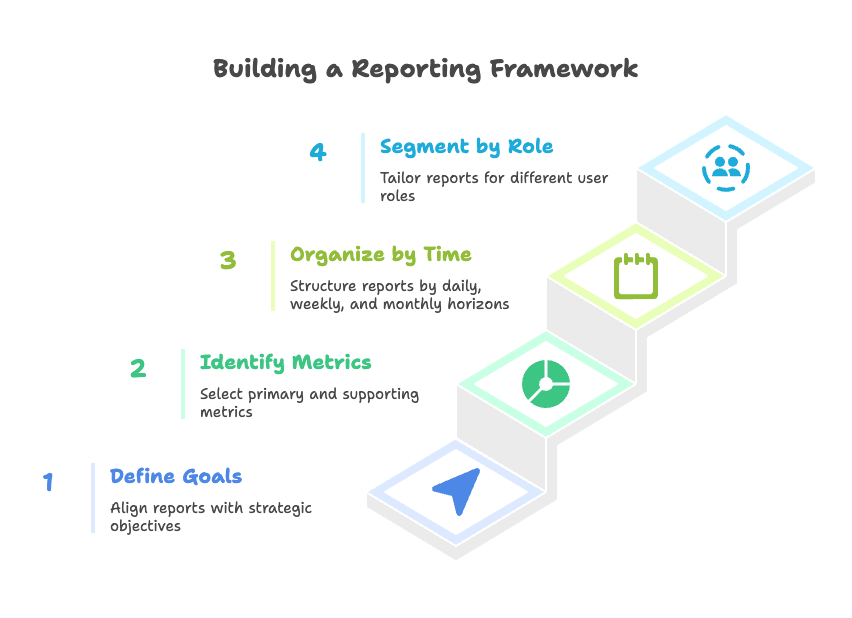
Before you dive into daily sales figures and weekly conversion rates, you need a solid foundation. Think of it like building a house—you wouldn’t start with the roof.
Defining Goals and KPIs
Your reports should tell a story that aligns with your strategic objectives. If you’re focused on growth, your reports need different data than if you’re optimizing profitability. This isn’t just about tracking everything you can—it’s about tracking what matters.
Start with your primary metrics. These are the numbers that directly impact your bottom line:
- Sales velocity: How fast are you generating revenue?
- Conversion rates: What percentage of visitors actually buy?
- Customer lifetime value: How much is each customer worth over time?
- Marketing ROI: Which campaigns actually pay off?
But here’s where it gets interesting. Supporting metrics give you the “why” behind your primary numbers. Daily sales tell you what happened. Daily traffic sources explain why it happened. Cart abandonment rates reveal what you can fix.
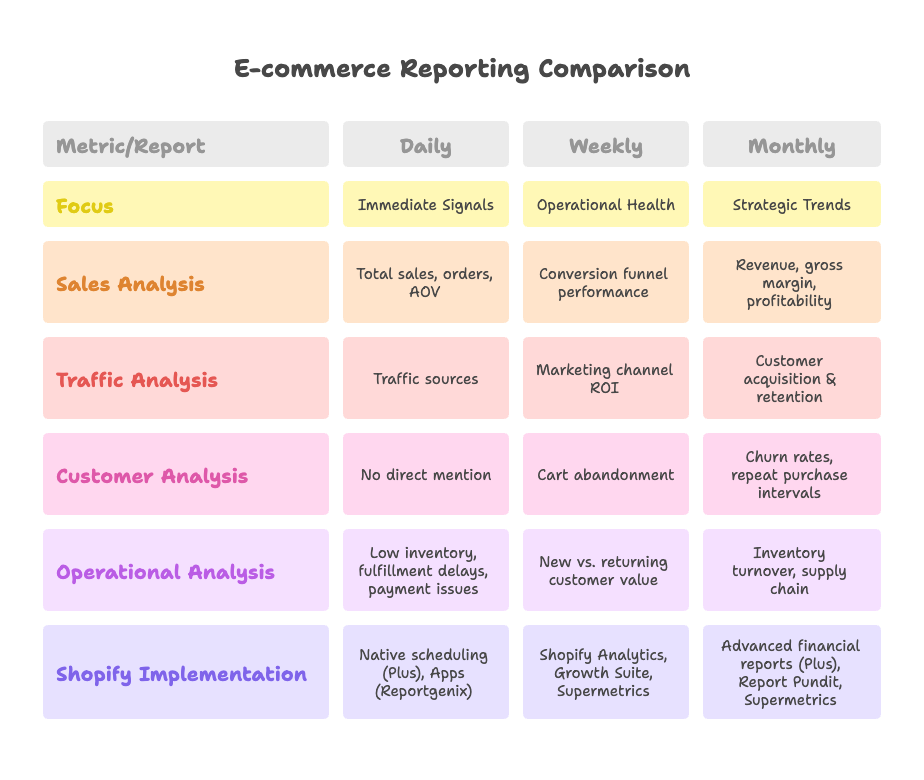
The magic happens when you organize these metrics by time horizon. Daily reports should focus on immediate signals—traffic spikes, inventory alerts, fulfillment issues. Weekly reports dive into operational health—funnel performance, channel effectiveness, customer behavior patterns. Monthly reports reveal strategic trends—profitability shifts, customer acquisition costs, long-term growth trajectories.
Segmenting Reports by User Role and Audience
Not everyone needs the same data. Your executive team wants high-level insights and actionable takeaways. Your store managers need operational details about inventory and fulfillment. Your marketing team craves channel performance and campaign analytics.
Executive summaries should be crisp. Key metrics at the top. Red flags highlighted. Action items clearly stated. Think elevator pitch, not encyclopedia.
Operational dashboards need more granular detail. Inventory levels by product. Order fulfillment metrics by location. Customer service response times. Returns and refund patterns. This is where your team makes daily decisions.
Marketing-focused analytics deserve their own category entirely. Channel performance comparisons. Email campaign results. Ad spend efficiency across platforms. Customer acquisition costs by source. This data drives your growth strategy.
Daily Reporting: Capturing Immediate Store Signals
Daily reports are your early warning system. They catch opportunities while they’re hot and problems before they spiral.
Core Daily Metrics
Your daily dashboard should answer three questions: How much did we sell? Where did customers come from? What needs immediate attention?
Total sales, orders, and average order value form your foundation. But raw numbers tell only half the story. Compare today against the same day last week. Against last month. Sudden drops might signal technical issues. Unexpected spikes could indicate viral social media mentions or successful ad campaigns.
Traffic sources reveal which marketing channels are paying off right now. Did that Instagram post drive a flood of visitors? Is your Google Ads campaign delivering qualified traffic? Are email subscribers actually converting? This information lets you double down on what’s working and quickly adjust what isn’t.
Then there are the operational alerts that can make or break your day. Low inventory warnings prevent stockouts during high-demand periods. Fulfillment delays help you proactively communicate with customers. Payment processing issues require immediate attention.
Here’s something many store owners miss: hourly sales trends. Peak shopping hours vary by industry and audience. Fashion retailers might see evening spikes. B2B sellers often peak mid-morning. Understanding these patterns helps with staffing decisions and flash promotion timing.
Implementation on Shopify
Shopify Plus users get native daily sales report scheduling. Set up email delivery for key stakeholders. Choose relevant report types. Schedule delivery for optimal viewing times—maybe 8 AM for morning coffee reviews or 6 PM for end-of-day analysis.
For those without Plus, apps like Reportgenix and Report Pundit offer robust automation. These tools can pull data from multiple sources, create custom templates, and deliver branded reports to different audience segments. The setup takes minutes, but the time savings compound daily.
Weekly Reporting: Monitoring Operational Health
Weekly reports shift focus from daily fluctuations to emerging patterns. They reveal trends that daily snapshots might miss.
Key Weekly Indicators
Your conversion funnel performance sits at the heart of weekly analysis. Track the journey from product views to purchases. Where do visitors drop off? Product pages with high views but low add-to-cart rates might have pricing or description issues. High cart additions but poor checkout completion could signal payment or shipping problems.
Cart abandonment deserves special attention in weekly reports. Daily abandonment spikes might indicate technical issues. Weekly patterns reveal customer behavior insights. Are abandonment rates higher on mobile? Do certain product categories see more cart exits? This data guides your recovery email strategy and site optimization efforts.
Marketing channel ROI becomes clearer over weekly timeframes. Daily performance can be noisy—one viral post can skew results. Weekly analysis smooths these fluctuations, revealing which channels consistently drive valuable traffic. Email might show steady performance. Social media could be feast-or-famine. Paid search might deliver reliable, if modest, returns.
The distinction between new and returning customer value also emerges weekly. New customers might have lower initial order values but higher long-term potential. Returning customers could show increased basket sizes but reduced frequency. These insights shape your retention and acquisition strategies.
Shopify-Specific Execution
Shopify Analytics offers powerful segmentation tools for weekly dashboard creation. Filter by customer type, traffic source, or product category. Export CSV files for deeper analysis in Excel or Google Sheets. The built-in cohort analysis reveals customer retention patterns that daily reports can’t capture.
Advanced users often integrate Shopify data with external tools. Growth Suite provides detailed visitor behavior tracking that complements Shopify’s native analytics. Supermetrics connects Shopify to Google Sheets or Data Studio for automated weekly report generation. These integrations eliminate manual data pulling and reduce human error.
Monthly Reporting: Strategic Trend Analysis
Monthly reports step back from operational details to examine strategic trends. This is where you make decisions that impact long-term growth.
Comprehensive Monthly Metrics
Revenue, gross margin, and profitability breakdown form the cornerstone of monthly analysis. Which products drive the most profit? How do shipping costs impact margins? Are promotional campaigns improving sales volume without destroying profitability?
Customer acquisition and retention metrics reveal the health of your growth engine. Customer acquisition costs should decrease over time as you optimize campaigns. Lifetime value should increase as you improve products and customer experience. The ratio between these metrics determines your business’s sustainability.
Churn rates and repeat purchase intervals provide early warning signs. Customers taking longer between purchases might indicate satisfaction issues. Increasing churn could suggest competitive pressure or product problems. These trends appear monthly before daily metrics catch them.
Inventory turnover and supply chain efficiency deserve monthly examination. Days of inventory on hand reveals cash flow efficiency. Stock-out costs show missed opportunities. Overstock expenses highlight forecasting problems. These metrics guide purchasing decisions and supplier relationships.
Advanced Shopify Applications
Shopify Plus users access advanced financial reports with monthly scheduling. Automated profit and loss statements. Balance sheet summaries. Multi-currency reporting for international operations. These reports can be distributed to different stakeholders automatically.
Third-party analytics platforms shine in monthly reporting. Report Pundit offers custom monthly modules that combine Shopify data with external sources. Supermetrics creates comprehensive KPI dashboards that track performance across multiple platforms. These tools provide the depth needed for strategic decision-making.
Automating and Scaling Your Reporting Schedule
Manual reporting works until it doesn’t. As your business grows, automation becomes essential for maintaining consistent insights without drowning your team in busywork.
Selecting the Right Tool
The best reporting tool integrates seamlessly with your existing Shopify setup. Look for native Shopify App Store applications that don’t require complex API configurations. Evaluate flexibility in scheduling—can you set different frequencies for different reports? Do templates support your brand guidelines?
Cost versus features requires careful consideration. Basic automation might cost $20-50 monthly. Advanced analytics platforms can run $200-500. Calculate the time savings. If automation saves your team five hours weekly, even expensive tools deliver positive ROI.
Best Practices for Automation
Clear naming conventions prevent confusion as your reporting library grows. Use consistent date formats. Include report type and frequency in filenames. Version control becomes crucial when multiple team members access reports.
Schedule report generation during off-peak hours. Large data exports can slow site performance during busy shopping periods. Most reporting tools allow flexible scheduling—use it wisely.
Regular audits ensure reports remain accurate and relevant. Data sources change. Metrics evolve. What seemed important six months ago might be noise today. Quarterly report reviews keep your insights sharp.
Security and Access Management
Not everyone needs access to every report. Financial data might be restricted to executives. Marketing metrics could be broader access. Operational reports might have department-specific distribution.
Encrypt sensitive data in transit. Use secure email services for report distribution. Consider password-protected files for highly confidential information. These precautions protect competitive intelligence and customer privacy.
Case Study: From Manual Spreadsheets to Automated Insights
Meet Sarah, who runs a mid-sized Shopify store selling artisanal home goods. Her story illustrates the transformation that systematic reporting can create.
Background: Mid-Sized Shopify Store Challenges
Eighteen months ago, Sarah’s team spent hours each week pulling data from different sources. Shopify analytics for sales. Google Analytics for traffic. Email platform for campaign results. Social media insights from three different networks. By the time they compiled everything, the data was already outdated.
Inconsistent metrics created confusion. Marketing team used last-click attribution. Operations team focused on Shopify’s multi-touch model. Executive reports mixed time zones and date ranges. Decisions got delayed while teams argued about which numbers were “correct.”
Implementation Roadmap
Sarah started with KPI definitions. Revenue growth, customer acquisition cost, and inventory turnover became primary metrics. Conversion rate, email performance, and social media engagement supported these priorities. Clear definitions eliminated metric confusion.
Tool selection came next. Reportgenix handled automated scheduling and email distribution. Shopify Plus native features provided high-level executive reports. The combination covered daily, weekly, and monthly needs without breaking the budget.
Rollout happened in stages. Daily sales reports launched first—simple but immediate value. Weekly funnel analysis followed once the team got comfortable with daily rhythms. Monthly strategic reports completed the system after three months.
Outcomes and Lessons Learned
Decision cycles accelerated by 30%. Problems got caught and fixed faster. Opportunities received quicker responses. Stock-outs decreased by 15% because inventory alerts reached the right people immediately.
Cross-team alignment improved dramatically. Everyone worked from the same data. Meetings focused on actions instead of arguing about numbers. Strategic planning became data-driven rather than gut-feeling-based.
The biggest lesson? Start simple and build complexity gradually. Perfect reports that nobody reads are worthless. Useful reports that people actually act on drive real business results.
Conclusion and Next Steps
Effective reporting schedules transform how you run your Shopify store. Daily reports catch immediate opportunities and problems. Weekly analysis reveals operational patterns. Monthly reviews guide strategic decisions. Together, they create a rhythm that keeps you ahead of your competition.
But reporting is only valuable if it drives action. The best insights in the world won’t help if they sit unread in your inbox.
Action Plan for Implementation
Start with an audit of your current reporting practices. What data do you look at daily? Weekly? Monthly? Where are the gaps? Which reports actually influence decisions?
Next, prioritize your KPIs and choose appropriate tools. Focus on metrics that directly impact your goals. Select tools that integrate well with your existing systems and won’t overwhelm your team.
Finally, roll out automation in phases. Begin with daily reports for immediate wins. Add weekly analysis once daily rhythms are established. Complete the system with monthly strategic reports.
Future Enhancements
Real-time dashboards and mobile alerts represent the next evolution. Imagine getting instant notifications when conversion rates spike or inventory runs low. These capabilities are becoming more accessible and affordable.
Predictive analytics and AI summaries are emerging rapidly. Instead of just reporting what happened, future systems will predict what might happen and suggest actions. This technology is moving from enterprise-level to Shopify app accessibility.
The stores that build systematic reporting habits today will be best positioned to leverage these advanced capabilities tomorrow. Your data discipline becomes the foundation for future competitive advantages.
References
- Koch, A. (2025). Ecommerce Reporting: The Only Guide You Need. Supermetrics. https://supermetrics.com/blog/ecommerce-reporting
- Shopify. (2024). Schedule Automated Reports in Shopify Plus. Silk Commerce. https://www.silkcommerce.com/shopify-plus/schedule-automated-reports-in-shopify-plus/
- Shopify. (2022). The Beginner’s Guide to Using Shopify Reports and Analytics. https://www.shopify.com/blog/analyzing-shopify-reports
- Supermetrics. (2025). Ecommerce Reporting: The Only Guide You Need. https://supermetrics.com/blog/ecommerce-reporting
- Growth Suite. (2025). Fix Sales Funnel Leaks: Stop Losing 97% of Your Traffic. https://www.growthsuite.net/solutions/how-to-identify-and-fix-the-biggest-leaks-in-your-sales-funnel
Ready to transform your Shopify store’s performance with data-driven insights and automated reporting? Growth Suite is a Shopify app that not only provides comprehensive visitor behavior tracking and detailed analytics reports, but also helps you convert more browsers into buyers with intelligent, personalized discount offers. Install it with a single click from the Shopify App Store and start making smarter decisions with better data today!