![]()
Picture this: You’re running a Shopify store that’s generating decent traffic, but you’re flying blind when it comes to understanding what’s actually driving your sales. Sound familiar? You’re not alone. Most Shopify store owners are sitting on a goldmine of data, yet they’re making critical business decisions based on gut feelings rather than hard facts.
Here’s the thing – successful e-commerce isn’t about luck or intuition. It’s about understanding your numbers, spotting trends before your competitors do, and making data-driven decisions that actually move the needle. The stores that master reporting strategy don’t just survive; they dominate their markets.
In this comprehensive guide, you’ll discover how to transform raw data into actionable insights that drive real growth. We’ll walk through everything from setting up basic analytics to implementing advanced reporting systems that can scale with your business. By the end, you’ll have a complete roadmap for building a reporting strategy that turns data into your competitive advantage.
Foundations of Shopify Reporting Strategy
Understanding the Business Impact of Data-Driven Decisions
Let’s start with a reality check. Stores using analytics achieve 96% goal completion rates compared to just 50% for those flying blind. That’s not a typo – it’s the difference between strategic growth and random guesswork.
When you implement proper reporting, three things happen immediately. First, you uncover hidden revenue opportunities that were always there but invisible without the right lens. Second, you eliminate time-wasting activities by focusing on what actually works. Third, you gain the ability to anticipate problems before they become expensive disasters.
Think about it this way: 79% of smartphone users make purchases based on accessible data insights. Your customers are already using data to make decisions. Shouldn’t you be doing the same?
Shopify Reporting Ecosystem Overview
Shopify gives you a solid foundation with over 60 built-in reports across 8 main categories. These aren’t just vanity metrics – they’re real-time insights that refresh every minute. You get everything from sales performance to customer behavior, inventory tracking to marketing attribution.
But here’s where it gets interesting. Native Shopify analytics are just the beginning. The real power comes when you start integrating external tools like Google Analytics 4, business intelligence platforms, and specialized reporting apps. This creates an ecosystem where every piece of data talks to every other piece, giving you a complete picture of your business.
The key is understanding what each tool does best. Shopify excels at transaction data and customer behavior. Google Analytics dominates traffic analysis and user journey tracking. Third-party apps fill specific gaps like cohort analysis, predictive modeling, and advanced attribution.
Strategic Framework for Reporting Success
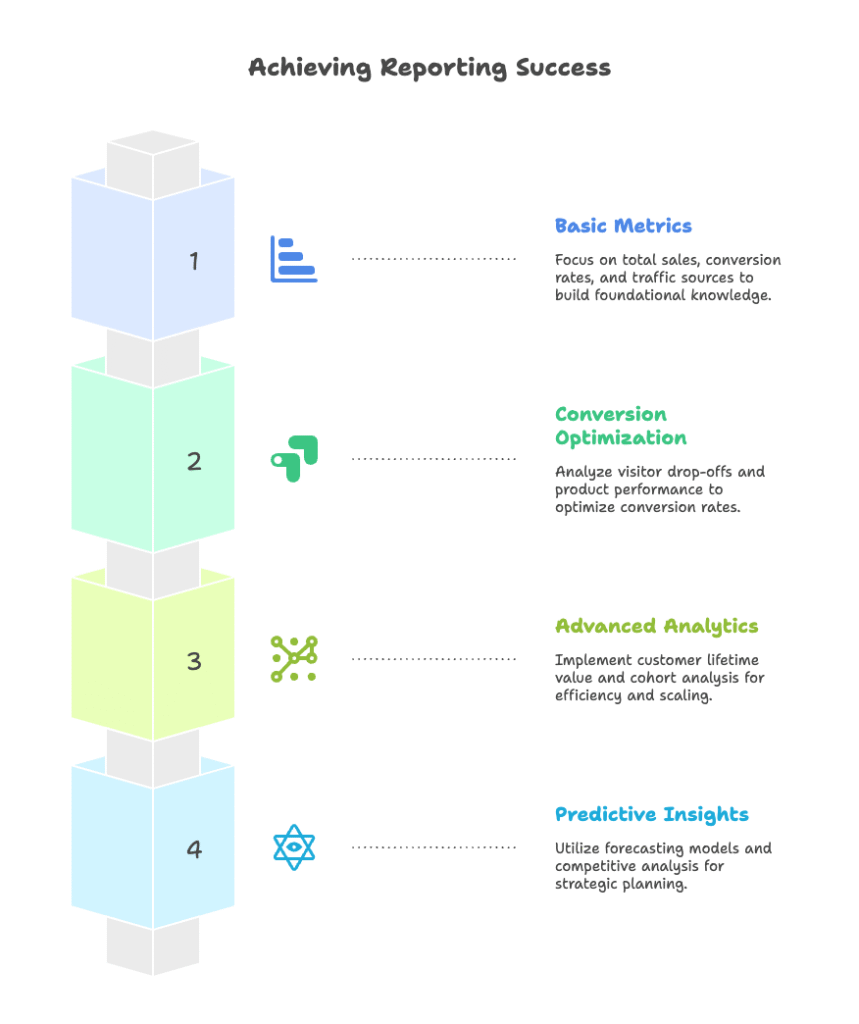
Not all store owners need the same reports. A starter who just launched needs different insights than an advanced operator running multiple channels. Here’s how to match your reporting strategy to your business stage.
Starter users should focus on basic performance metrics: total sales, conversion rates, and traffic sources. You’re building foundational knowledge, so keep it simple but comprehensive.
Beginner users need conversion optimization data: where visitors drop off, which products perform best, and how different traffic sources convert differently.
Intermediate users require advanced analytics: customer lifetime value, cohort analysis, and multi-channel attribution. You’re optimizing for efficiency and scaling what works.
Advanced users demand predictive insights: forecasting models, competitive analysis, and strategic planning data. You’re thinking three moves ahead of your competition.
Core Metrics and Key Performance Indicators
Financial Performance Metrics
Money talks, but only if you’re listening to the right conversations. Revenue tracking isn’t just about counting dollars – it’s about understanding the story those dollars tell about your business health.
Start with total sales, but don’t stop there. Net sales tell a different story once you factor in returns, discounts, and allowances. Break this down by product, collection, and sales channel. You’ll quickly spot which products are your real profit drivers and which channels deserve more investment.
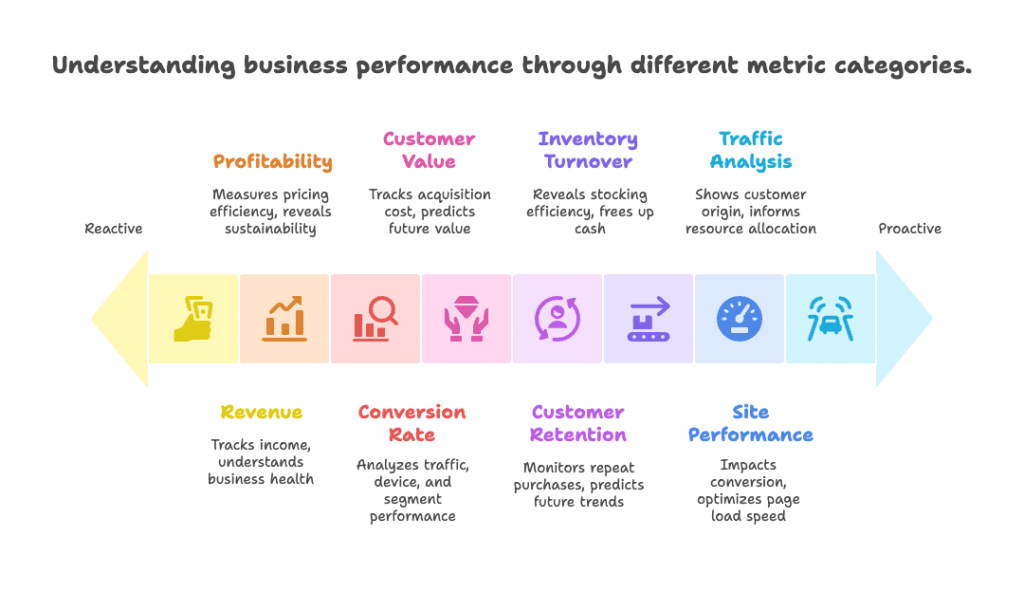
Profitability analysis takes this deeper. Gross profit margin shows how efficiently you’re pricing and sourcing products. But net profit margin – that’s where the rubber meets the road. It reveals whether you’re building a sustainable business or just generating revenue at the expense of long-term viability.
Customer Behavior and Acquisition Metrics
Your conversion rate is your store’s vital sign. Industry average hovers around 2-3%, but don’t get comfortable with average. The real insight comes from analyzing conversion rates by traffic source, device type, and customer segment.
Average Order Value (AOV) and Customer Lifetime Value (LTV) work together like a powerful one-two punch. AOV shows how much customers spend per transaction. LTV reveals their total worth over time. But here’s the crucial part: you need to track these against Customer Acquisition Cost (CAC). The golden ratio? LTV should be at least three times your CAC.
Customer retention metrics deserve special attention because acquiring new customers costs five times more than retaining existing ones. Track repeat purchase rates, customer retention by cohorts, and churn patterns. These numbers predict your future better than any crystal ball.
Operational Performance Indicators
Behind every successful sale is a well-oiled operational machine. Inventory turnover rates reveal whether you’re stocking smart or tying up cash in slow-moving products. Site performance metrics like page load speed directly impact conversion – a one-second delay can cost you 7% of conversions.
Traffic analysis by source and device type shows where your customers come from and how they prefer to shop. This isn’t just interesting data; it’s actionable intelligence for resource allocation and marketing strategy.
Shopify Native Analytics Implementation
Setting Up Shopify Analytics Dashboard
Your Shopify dashboard is command central, but most store owners barely scratch the surface of what’s possible. The metrics library contains dozens of data points, but the magic happens when you customize it for your specific business needs.
Start by selecting KPIs that directly relate to your business goals. If you’re focused on growth, prioritize conversion rates and customer acquisition metrics. If profitability is the goal, emphasize margin analysis and AOV tracking. Don’t try to track everything – focus on the numbers that drive decisions.
Date range standardization matters more than you think. Consistent reporting periods allow for meaningful comparisons and trend identification. Whether you choose weekly, monthly, or quarterly reviews, stick to it religiously.
Leveraging Built-in Reporting Tools
The Overview Dashboard gives you the pulse of your business at a glance, but the real insights hide in the detailed reports. Sales funnel visualization shows exactly where potential customers drop off. Product performance analysis reveals which items deserve promotion and which need improvement.
Live View is particularly powerful during promotional campaigns or peak traffic periods. You can watch real-time visitor behavior, geographic patterns, and device preferences. This immediate feedback allows for rapid campaign adjustments and optimization.
Data Export and Integration Workflows
Raw data becomes powerful when it flows seamlessly between systems. Set up automated CSV exports for deeper analysis in Excel or Google Sheets. Connect with Google Analytics 4 through the Google & YouTube app for unified customer journey tracking.
Email automation for stakeholder reports keeps everyone informed without manual effort. Weekly summaries for operational teams, monthly overviews for management, and quarterly strategic reviews for planning sessions create a rhythm of data-driven decision making.
Advanced Reporting Tools and Integrations
Business Intelligence Platform Integration
When your business outgrows basic analytics, it’s time for business intelligence platforms. Data warehouses like BigQuery and Snowflake handle massive datasets while maintaining query speed. ETL processes ensure data quality and consistency across all sources.
Visualization platforms like Power BI and Looker Studio transform complex data into intuitive dashboards. The key is choosing tools that match your team’s technical capabilities and business requirements. A beautiful dashboard that nobody understands won’t drive decisions.
Specialized Shopify Reporting Applications
The Shopify App Store contains powerful reporting solutions designed specifically for e-commerce needs. Mipler Advanced Reports offers custom dashboard creation with drag-and-drop simplicity. Data Export IO provides automated report scheduling and distribution.
Specialized tools like Rick.ai bring predictive analytics to Shopify stores, while Growth Suite adds behavioral analytics and conversion optimization insights. The trick is evaluating each tool’s integration capabilities and learning curve against the insights it provides.
API-Driven Custom Reporting Solutions
For businesses with unique reporting needs, Shopify’s Admin API opens up unlimited possibilities. Custom report creation via API allows for business-specific metrics and analysis. Real-time webhooks provide instant notifications for critical events.
Development best practices include rate limiting consideration, error handling implementation, and security measures for data protection. Plan for scalability from the start – what works for 100 orders per day might break at 1,000.
Data Collection and Quality Management
Comprehensive Data Gathering Strategies
Great reporting starts with great data collection. Multi-source integration creates a complete picture of your customer journey. Shopify provides transaction data, Google Analytics reveals traffic behavior, and social media platforms show engagement patterns.
Event tracking implementation captures actions beyond basic page views. Custom events for video watching, PDF downloads, or specific product interactions provide deeper behavioral insights. Enhanced e-commerce tracking reveals detailed transaction information that drives optimization decisions.
Privacy Compliance and Data Governance
Data privacy isn’t just legal compliance – it’s customer trust. GDPR and privacy regulation adherence requires consent management systems and clear data retention policies. Users have rights including data access and deletion that must be honored.
Data security measures protect both your business and customers. Encryption for data in transit and at rest, access controls for sensitive information, and regular security audits prevent costly breaches and maintain customer confidence.
Data Architecture and Storage Solutions
Scalable storage planning anticipates future growth. Cloud-based solutions offer flexible capacity management while data lifecycle policies optimize costs. Backup and recovery procedures ensure business continuity during technical failures.
Schema design and indexing strategies improve query performance, especially important as data volumes grow. Proper data structure today prevents expensive migrations tomorrow.
Dashboard Design and Visualization Best Practices
User-Centric Dashboard Development
Different stakeholders need different views of the same data. Executive dashboards focus on high-level KPIs and trends. Marketing team dashboards emphasize campaign performance and ROI. Operations dashboards highlight inventory and fulfillment metrics.
Visual hierarchy guides attention to the most important information first. Progressive disclosure prevents information overload while maintaining depth for users who need it. Color coding provides instant status recognition – green for good, red for problems, yellow for caution.
Visualization Selection and Optimization
Chart type selection can make or break dashboard effectiveness. Line charts excel at showing trends over time. Bar charts compare categories and rankings clearly. Heat maps reveal patterns in complex datasets.
Performance optimization becomes critical as dashboards grow complex. Data aggregation speeds loading times. Progressive loading handles large datasets gracefully. Caching strategies serve frequently accessed reports instantly.
Advanced Visualization Techniques
Predictive analytics visualization shows where your business is headed, not just where it’s been. Forecasting charts with confidence intervals help plan inventory and staffing. Scenario analysis presents different outcomes based on strategic decisions.
Comparative analysis presentations benchmark performance against industry standards, year-over-year comparisons, and A/B testing results. These visualizations transform data into strategic guidance.
Automated Reporting and Alert Systems
Report Automation Implementation
Manual reporting consumes time that could be spent on analysis and action. Scheduled report generation creates consistent information flow: daily summaries for operational monitoring, weekly trends for tactical planning, monthly reviews for strategic assessment.
Dynamic report content adapts to current conditions. Automated narrative generation provides context for numbers. Anomaly detection highlights unusual patterns that require attention. Recommendation engines suggest actions based on data trends.
Alert and Notification Systems
Alerts transform reactive businesses into proactive ones. Performance threshold monitoring catches problems early. Revenue target tracking provides early warning when goals are at risk. Inventory level warnings prevent costly stockouts.
Opportunity identification alerts are equally important. Traffic spike notifications enable rapid scaling responses. High-performing product alerts guide promotional focus. Customer behavior anomalies might indicate retention risks or upsell opportunities.
Intelligent Automation Features
Machine learning integration takes automation to the next level. Pattern recognition generates insights automatically. Predictive alerting identifies problems before they manifest. Automated A/B testing continuously optimizes performance.
Natural language processing makes data accessible to non-technical team members. Automated report summarization creates executive briefings. Question-answering systems democratize data access across the organization.
Performance Measurement and Optimization
ROI Calculation and Attribution
Every reporting investment should pay for itself through better decisions. Marketing ROI measurement requires sophisticated attribution modeling that tracks customer journeys across multiple touchpoints. Customer acquisition cost calculation must account for all channels and time delays.
Return on ad spend (ROAS) optimization demands accurate tracking and rapid feedback loops. The lifetime value to acquisition cost ratio should maintain at least 3:1 for sustainable growth.
Continuous Improvement Framework
Regular performance review cycles create organizational discipline around data-driven decision making. Weekly tactical reviews enable rapid adjustments. Monthly strategic assessments guide planning updates. Quarterly comprehensive evaluations inform major decisions.
A/B testing and experimentation require statistical significance calculations for reliable results. Test duration planning ensures accurate measurement. Segment-specific testing provides targeted optimization opportunities.
Data-Driven Decision Making Process
Hypothesis formation and testing creates a scientific approach to business optimization. Data-backed hypotheses improve success rates. Control groups enable accurate comparison. Success metrics provide clear evaluation criteria.
Implementation monitoring catches issues early. Real-time tracking enables rapid corrections. Stakeholder communication manages change effectively. Documentation preserves knowledge for future reference.
Team Training and Adoption Strategies
Skill Development and Education
Analytics literacy isn’t optional in modern e-commerce. Basic statistics training helps team members interpret reports correctly. Data visualization principles improve communication effectiveness. Tool-specific training maximizes platform utilization.
Role-specific training programs address different needs. Executives need dashboard interpretation skills. Marketing teams require campaign optimization knowledge. Operations staff benefit from efficiency improvement metrics.
Change Management and Adoption
Stakeholder buy-in requires demonstrating clear ROI from reporting investments. Quick wins build momentum and credibility. Success story sharing motivates broader adoption. Resistance identification and mitigation prevents project failures.
Implementation support systems ease the transition. Help desk availability addresses technical issues. Documentation enables self-service support. Champion programs provide peer-to-peer assistance.
Governance and Best Practices
Data governance frameworks ensure consistency and accuracy. Data quality standards prevent bad decisions from bad data. Access controls protect sensitive information while enabling necessary analysis.
Reporting standards and procedures create consistency across the organization. Template creation speeds report development. Review processes catch errors before distribution. Archive systems preserve historical data for trend analysis.
Future-Proofing and Scalability Planning
Technology Evolution Preparation
Artificial intelligence and machine learning integration will revolutionize e-commerce analytics. Real-time analytics capabilities continue advancing. Voice and conversational analytics are emerging. Augmented reality shopping experiences will need new measurement approaches.
Platform scalability considerations include data volume growth planning, user base expansion support, and feature enhancement accommodation. Plan for success – today’s solution should handle tomorrow’s growth.
Business Growth Accommodation
Multi-channel expansion requires unified analytics across marketplaces, international markets, and B2B wholesale operations. Product and service evolution demands new measurement approaches for subscriptions, digital products, and personalization.
Organizational structure adaptation includes departmental reporting autonomy, cross-functional collaboration tools, and distributed team support for remote operations.
Innovation and Competitive Advantage
Advanced analytics implementation provides market anticipation capabilities. Predictive analytics forecast demand and trends. Prescriptive analytics automate optimization decisions. Real-time personalization improves customer experiences.
Customer experience enhancement through journey analytics, sentiment analysis, and behavioral prediction creates competitive differentiation. Operational excellence through supply chain analytics, quality control metrics, and risk assessment protects business sustainability.
References
- Saras Analytics. (2025). Shopify Analytics Dashboard: A Comprehensive Guide. Retrieved from https://www.sarasanalytics.com/blog/shopify-analytics-dashboard
- Shopify. (2025). Shopify Analytics and Reporting Dashboards. Retrieved from https://www.shopify.com/analytics
- Conjura. (2025). Shopify Analytics and Reporting: How to Get More Out of Your Ecommerce. Retrieved from https://www.conjura.com/blog/shopify-analytics-and-reporting-how-to-get-more-out-of-your-ecommerce
- Ecorn Agency. (2019). Mastering Your Shopify Analytics Dashboard: A Complete Guide to Data-Driven Success. Retrieved from https://www.ecorn.agency/blog/master-shopify-analytics-dashboard-guide-data-driven-success
- Shopify. (2025). Store Performance Dashboard: Essential Reports and How To Track. Retrieved from https://www.shopify.com/nz/retail/store-performance-dashboard
- Albato. (2024). The Best Shopify Analytics Tools in 2025: Comparison. Retrieved from https://albato.com/blog/publications/top-shopify-analytics-tools-2024
- Supermetrics. (2025). Ecommerce Reporting: The Only Guide You Need. Retrieved from https://supermetrics.com/blog/ecommerce-reporting
Ready to transform your Shopify store’s data into a competitive advantage? Growth Suite is a powerful Shopify app that goes beyond basic analytics to provide behavioral insights and conversion optimization tools. It tracks visitor behavior, predicts purchase intent, and optimizes discount strategies to maximize your return on ad spend. With comprehensive reporting features including funnel analysis, product performance tracking, and purchase insights, Growth Suite helps you make smarter, data-driven decisions that directly impact your bottom line. Install Growth Suite with a single click and start turning your data into revenue growth!