![]()

The Strategic Importance of Instagram Analytics for Shopify Store Owners
Ever wonder why some Shopify stores seem to effortlessly turn Instagram followers into paying customers while others struggle to see any return? The difference often lies not in the products or even the content, but in how they measure, analyze, and act on their Instagram performance data.
Instagram has evolved from a simple photo-sharing app into a powerhouse sales channel for e-commerce businesses. But without proper analytics, you’re essentially navigating blindfolded—posting content and running ads without truly understanding what works and what doesn’t. The good news? You’re about to remove that blindfold.
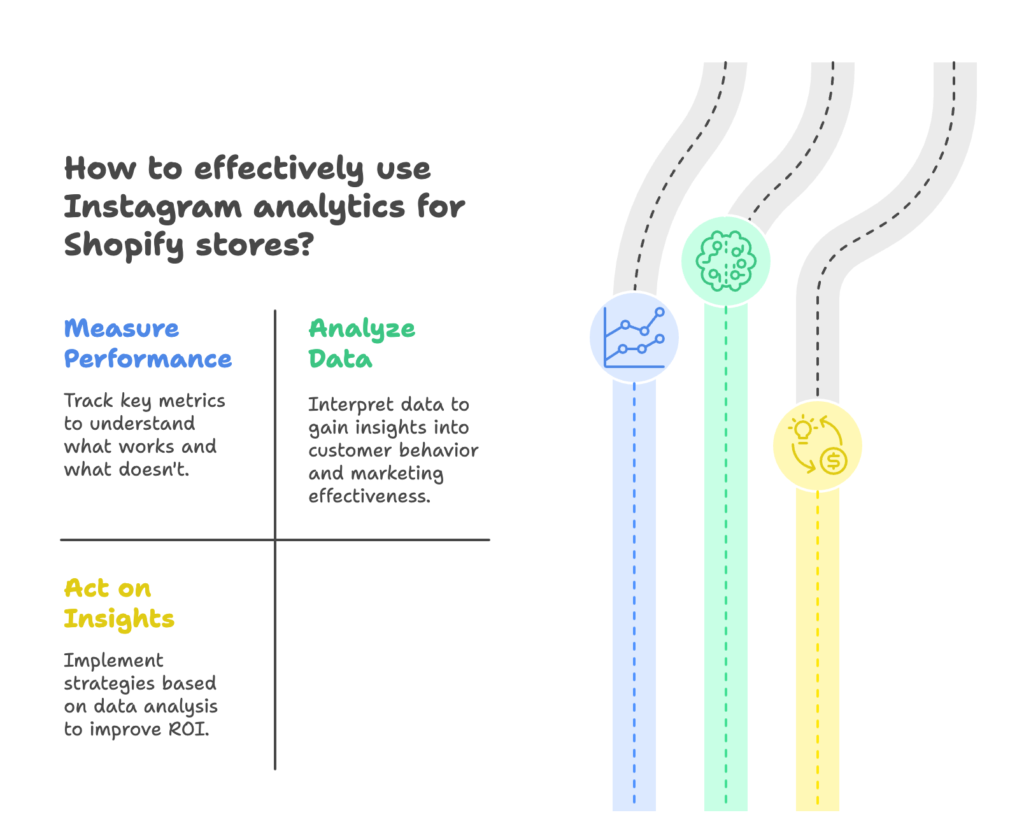
In this guide, you’ll discover exactly how to set up, measure, and optimize your Instagram marketing to drive real, measurable results for your Shopify store. From basic metrics tracking to advanced attribution modeling, we’ve got you covered with actionable strategies that work in 2025, not outdated tactics from years ago.
The Instagram-Shopify Connection: A Powerful E-commerce Synergy
Instagram’s transformation has been nothing short of revolutionary. What began as a creative outlet for photographers has become an essential marketing and sales channel for businesses of all sizes. For Shopify store owners specifically, this platform offers unique opportunities that simply don’t exist elsewhere.
Think about it: where else can you showcase your products, tell your brand story, build a community, AND enable direct purchasing—all within a single platform? The integration capabilities between Instagram and Shopify have expanded dramatically, allowing for seamless shopping experiences that reduce friction and boost conversion rates.
But this powerful synergy only delivers real results when you understand what’s working and why. And that’s where analytics comes in.
Current Instagram Usage Statistics for E-commerce
The numbers don’t lie—Instagram has become a shopping destination in its own right:
- Over 72% of users make purchase decisions based on content they see on Instagram
- In 2023, more than 35% of users completed purchases directly through Instagram ads
- Approximately 15% of US shoppers now begin their online shopping searches on Instagram rather than Google
- Instagram stories generate roughly 25% of the platform’s ad revenue, highlighting their effectiveness
These statistics represent enormous opportunity, but tapping into that potential requires more than just posting pretty pictures. Success demands a strategic, data-driven approach.
The Competitive Advantage of Data-Driven Instagram Marketing
Data is the difference-maker in today’s competitive e-commerce landscape. While your competitors might be creating content based on gut feelings or chasing the latest trends without measuring results, you can gain a significant edge by letting analytics guide your decisions.
With proper measurement systems in place, you can:
- Identify exactly which content types drive the most sales for your specific audience
- Calculate the true ROI of your Instagram marketing efforts down to the penny
- Understand the complete customer journey from first Instagram impression to repeat purchase
- Allocate your marketing budget more effectively based on actual performance data
But this advantage doesn’t come automatically. It requires intentional setup and consistent analysis—exactly what we’ll cover in this guide.
The Challenges of Measuring Instagram ROI for Shopify Owners
Before diving into solutions, it’s important to acknowledge the very real challenges of measuring Instagram marketing performance. Understanding these obstacles is the first step to overcoming them.
Attribution Complexities in Social Media Marketing
Here’s the truth: the customer journey is rarely as simple as “see post → click link → buy product.” A typical customer might discover your brand through an Instagram story, later search for your store on Google, browse products on their lunch break, and finally make a purchase after seeing a retargeting ad weeks later.
So which marketing touch deserves credit for the sale? This multi-touch reality makes attribution genuinely challenging, especially when customers switch between devices during their journey. But don’t worry—we’ll explore practical solutions to these challenges.
Balancing Tangible and Intangible Metrics
Not everything that matters can be measured, and not everything that can be measured matters. Some Instagram activities build brand equity and customer relationships in ways that don’t immediately translate to sales figures.
How do you quantify the value of increased brand recognition? What’s the dollar value of customer trust? Striking the right balance between hard conversion metrics and softer engagement metrics is an ongoing challenge, but one that becomes easier with the right framework.
Technical Limitations and Solutions
Instagram and other social platforms have their own agenda when it comes to data sharing and measurement. Recent privacy changes, including iOS updates and cookie restrictions, have made tracking more difficult than ever before.
The good news? There are workarounds, alternative measurement approaches, and technical solutions that can help you overcome most of these limitations. The key is knowing which tools to use and how to configure them properly—which brings us to our next section.
Setting Up Instagram Analytics Infrastructure for Your Shopify Store
Good data starts with proper setup. No amount of analysis can compensate for a flawed tracking infrastructure. Let’s build a solid foundation for your Instagram analytics system.
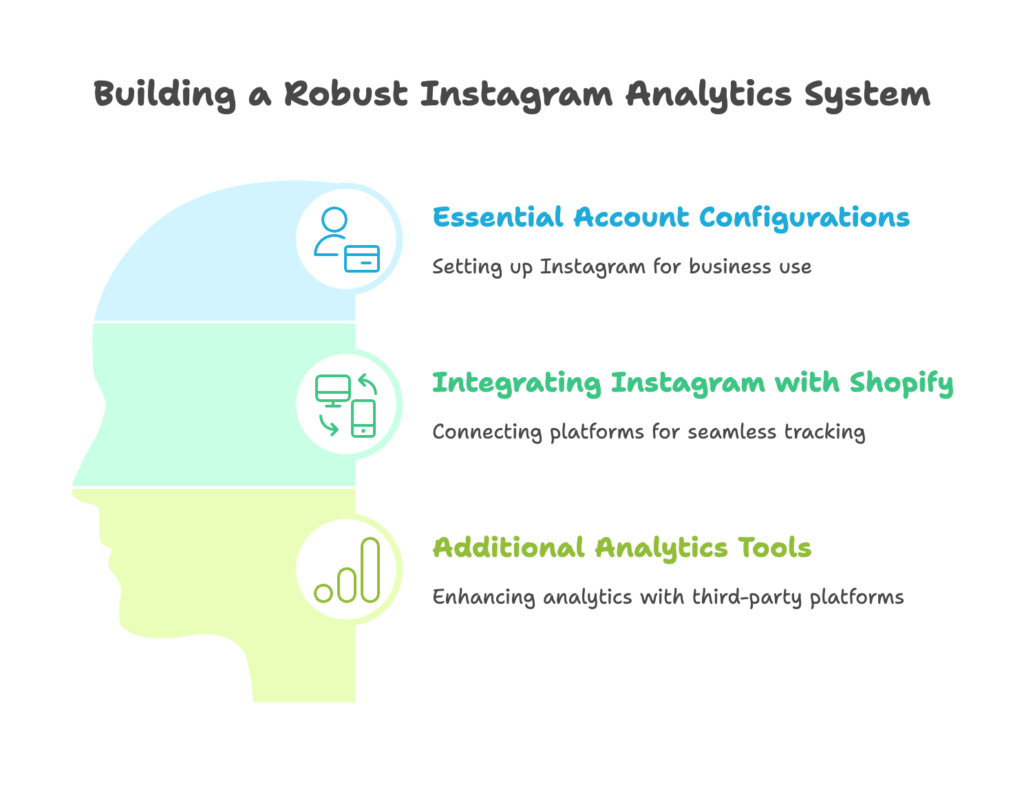
Essential Account Configurations
Before diving into complex tracking systems, ensure you’ve configured your Instagram account properly for business use. These fundamental settings unlock the basic analytics features you’ll need.
Converting to an Instagram Business Account
If you’re still using a personal Instagram account for your Shopify store, you’re missing out on critical analytics features. Converting to a business account takes just a few minutes and provides immediate access to Instagram Insights—the platform’s native analytics tool.
Here’s how to convert:
- Go to your profile and tap the hamburger menu (≡) in the top right
- Select Settings and privacy
- Scroll down to “Account type and tools”
- Tap “Switch account type” and select “Business”
- Follow the prompts to connect to your Facebook page
Once converted, you’ll gain access to demographic data about your followers, reach and impression metrics for your posts, and basic website click tracking—all essential building blocks for measuring performance.
Connecting Instagram to Facebook Business Manager
To unlock Instagram’s full analytics and advertising potential, you need to connect it to Facebook Business Manager. This integration enables more advanced tracking options and access to the comprehensive reporting tools within Meta’s Business Suite.
If you don’t already have a Facebook page for your business, create one first. Then:
- Go to business.facebook.com and sign up for Business Manager
- Add your business details and verify ownership
- Under Business Settings, add your Instagram account as a property
- Connect your Facebook page to your Instagram account
With this connection established, you’ll have a centralized dashboard for managing both platforms and can begin setting up the product catalog needed for shopping features.
Enabling Instagram Shopping Features
Instagram Shopping unlocks powerful features like product tags in posts and stories, a dedicated Shop tab on your profile, and checkout capabilities. These features not only improve user experience but also provide additional tracking points for your analytics.
To enable Shopping:
- Ensure your business meets Instagram’s commerce eligibility requirements
- Set up your product catalog in Facebook Commerce Manager
- Submit your account for review (this typically takes 2-3 business days)
- Once approved, activate shopping features in your Instagram professional dashboard
With Shopping enabled, you’ll gain access to product-specific metrics like product page views, product clicks, and direct purchases—invaluable data for measuring your Instagram ROI.
Integrating Instagram with Shopify
The magic happens when Instagram and Shopify communicate seamlessly. This integration allows for accurate tracking of user journeys across both platforms and provides the most complete picture of your marketing performance.
Installing the Facebook & Instagram App by Meta
Shopify’s official Facebook & Instagram app provides the foundation for proper cross-platform tracking. This app synchronizes your product catalog, enables shopping features, and facilitates accurate attribution.
To install:
- Go to the Shopify App Store and search for “Facebook & Instagram”
- Add the official app by Meta to your store
- Follow the setup wizard to connect your Facebook account
- Set up your product feed and customize which products sync to Instagram
During setup, you might encounter connection issues, particularly around product catalog syncing. Common solutions include ensuring your products have high-quality images that meet Instagram’s requirements (minimum 500×500 pixels) and that all products contain detailed descriptions.
Setting Up Meta Pixel for Cross-Platform Tracking
The Meta Pixel is a snippet of code that tracks user actions across your website and connects them back to your Instagram and Facebook advertising. It’s absolutely essential for accurate attribution and performance measurement.
Fortunately, the Facebook & Instagram app automatically installs the base pixel, but you’ll want to configure additional events for comprehensive tracking:
- In Shopify, go to Online Store → Preferences
- Verify that Facebook Pixel is installed (should show as “Connected”)
- In Facebook Events Manager, set up standard events like Add to Cart, Initiate Checkout, and Purchase
- Consider adding custom events for actions specific to your business model
For advanced tracking, configure the pixel to pass additional parameters like product IDs, value, and currency. This allows for much more detailed reporting on exactly which products generate interest from Instagram traffic.
Syncing Your Product Catalog
A properly configured product catalog ensures that product data flows accurately between Shopify and Instagram. This synchronization is crucial not just for shopping features but also for detailed analytics.
For optimal catalog management:
- Organize products into logical collections that match how you’ll promote them on Instagram
- Ensure product titles and descriptions are optimized for both Instagram and search discovery
- Set up automatic inventory and price syncing to avoid discrepancies
- Add Instagram-specific product tags or attributes to help with categorization
A well-maintained catalog doesn’t just improve the shopping experience—it provides cleaner data for analyzing which product categories perform best on Instagram.
Additional Analytics Tools for Enhanced Measurement
While the native tools from Meta and Shopify provide a solid foundation, serious e-commerce marketers often need additional tools to get the complete picture.
Third-Party Analytics Platforms
Several specialized platforms can enhance your Instagram analytics capabilities beyond what’s available natively:
- Curator.io – Particularly useful for embedding shoppable Instagram feeds on your Shopify store and measuring their performance
- Dash Hudson – Offers AI-powered insights specifically for visual content performance
- Iconosquare – Provides competitive benchmarking and historical performance data
- Later – Combines scheduling tools with analytics focused on content performance
When selecting a third-party tool, prioritize those that integrate directly with both Instagram and Shopify to ensure data consistency across your analytics ecosystem.
Email Marketing Integration for Full-Funnel Analysis
The Instagram-to-email pipeline is often overlooked but critically important for measuring the full value of your Instagram marketing. By connecting your email marketing platform (like Klaviyo) to your Instagram strategy, you can:
- Track how many email subscribers came from Instagram
- Calculate the lifetime value of Instagram-acquired subscribers
- Create segments based on Instagram engagement for more targeted email campaigns
- Measure incremental revenue from email subscribers who originally came from Instagram
This integration provides a more complete picture of Instagram’s contribution to your business beyond direct, same-session purchases.
Custom Dashboard Creation
As your analytics setup grows more sophisticated, you’ll likely want a centralized dashboard that brings all your data together. Tools like Google Data Studio, Tableau, or even a custom Excel dashboard can consolidate metrics from multiple sources.
An effective dashboard should:
- Focus on your most important KPIs rather than overwhelming you with data
- Update automatically or with minimal manual input
- Include both trend data and current performance metrics
- Allow for easy comparison against goals and previous periods
The time invested in creating a custom dashboard pays dividends through faster, more informed decision-making and less time spent gathering data from disparate sources.
Key Instagram Metrics Shopify Owners Should Track
Now that your analytics infrastructure is in place, what exactly should you be measuring? Let’s break down the essential metrics into four categories: awareness, engagement, conversion, and customer value.
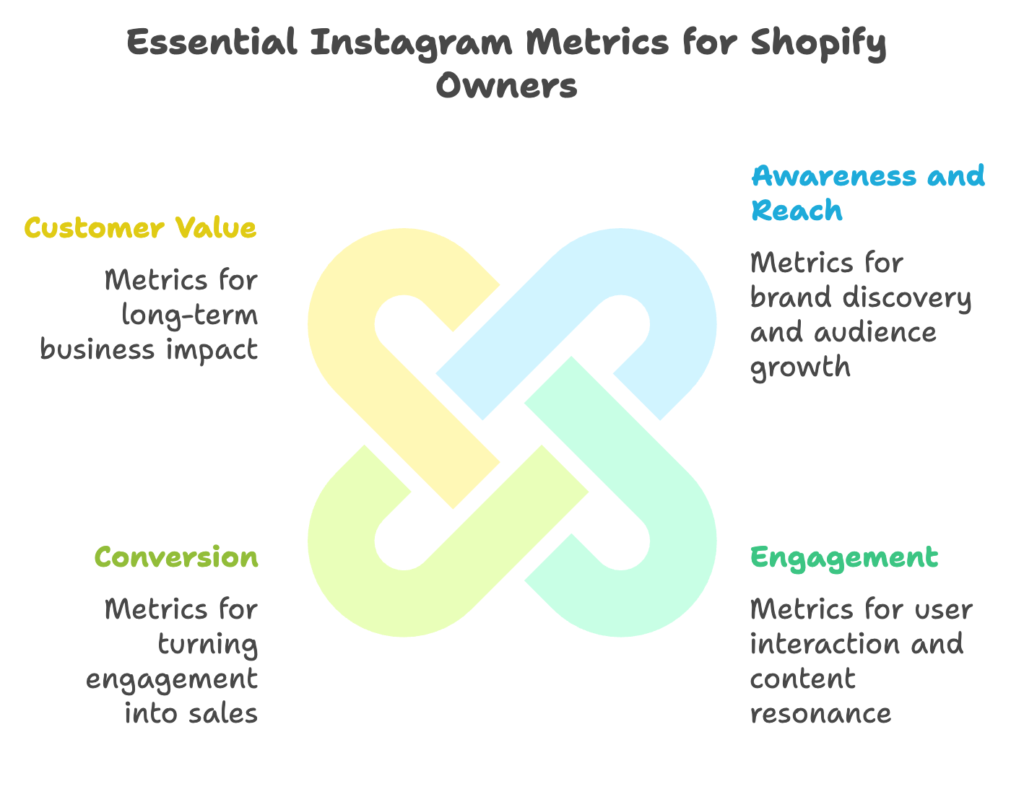
Awareness and Reach Metrics
These top-of-funnel metrics help you understand how many potential customers are discovering your brand on Instagram—the first step in the customer journey.
Follower Growth Rate
Raw follower counts tell an incomplete story. What matters more is your follower growth rate—the percentage increase in followers over a specific timeframe. This relative metric helps you understand if your audience building is accelerating or slowing down.
Calculate it by: ((New followers in period ÷ Total followers at start of period) × 100)
A healthy growth rate depends on your industry and account size, but generally, look for consistent upward trends rather than sporadic spikes followed by plateaus. If you notice your growth rate declining, it often signals a need to refresh your content strategy or increase your posting consistency.
Impressions and Reach
Impressions measure the total number of times your content was viewed, while reach counts the unique users who saw it. The relationship between these metrics reveals how frequently your content is being shown to the same people.
A high impressions-to-reach ratio might indicate strong content that Instagram’s algorithm is showing repeatedly, or it could mean you’re not expanding beyond your existing audience. Which interpretation is correct depends on your specific goals.
Pay particular attention to reach expansion—the percentage of your reach that comes from non-followers. This metric indicates how effectively you’re breaking out of your existing audience bubble to find new potential customers.
Discovery Rate and Brand Awareness
How are new users finding your content? Instagram Insights breaks down discovery by source, helping you understand which discovery channels (hashtags, explore page, suggested content, etc.) are working hardest for your brand.
Beyond these platform metrics, consider tracking:
- Brand mention volume across Instagram
- Hashtag usage for branded hashtags
- Share of voice compared to competitors (how often your brand is mentioned versus competitors)
These awareness metrics won’t directly tie to sales, but they’re essential leading indicators that help you gauge if your Instagram presence is growing in the right direction.
Engagement Metrics
Engagement represents the middle of your funnel—users who’ve moved beyond awareness to actively interacting with your content. These metrics help you understand content resonance and audience interest.
Interaction Rates
Different interactions carry different weights in terms of signaling intent and interest:
- Likes – The most basic engagement, showing general appreciation
- Comments – Stronger engagement indicating enough interest to start a conversation
- Saves – High-intent action showing users want to revisit content later
- Shares – Powerful endorsement where users promote your content to their audience
Rather than focusing on raw numbers, calculate your engagement rate: (Total interactions ÷ Impressions) × 100. This normalized metric allows for fair comparison across posts with different reach levels.
For Shopify stores in 2025, healthy engagement rates typically fall between 1-5%, though this varies by industry, follower count, and content type. Consistently tracking this metric helps you identify which content themes and formats resonate most with your audience.
Story Performance
Instagram Stories offer unique engagement metrics worth separate analysis:
- Completion rate – Percentage of viewers who watch your story from first to last frame
- Exit rate – Percentage of viewers who leave your stories after a specific frame
- Tap-forward rate – How often viewers skip ahead through your content
- Tap-back rate – How often viewers return to previous frames (often a positive sign)
Story interactions like poll responses, questions, and sliders provide additional engagement data. These interactive elements not only boost engagement stats but also generate valuable zero-party data about your audience’s preferences.
Content Effectiveness by Format
Instagram’s multiple content formats (Feed posts, Stories, Reels, Guides, etc.) each perform differently and serve different purposes in your marketing mix. Track performance by format to optimize your content strategy.
In 2025, Reels typically generate the highest reach but often with lower conversion intent, while Shopping posts might have more limited reach but higher purchase intent. Understanding these patterns helps you strategically choose formats based on your specific marketing objectives.
Beyond format, analyze performance by content theme, posting time, and product category. This multi-dimensional analysis reveals patterns that simple engagement metrics might miss.
Conversion Metrics
Now we’re getting to the metrics that directly impact your bottom line. Conversion metrics track how effectively you’re turning Instagram engagement into tangible business results.
Click-Through Rates (CTR)
CTR measures the percentage of people who take the crucial step of leaving Instagram to visit your website or product pages. Track CTR for:
- Profile bio link (calculate as link clicks divided by profile views)
- Story links (link clicks divided by story impressions)
- Product tags (product clicks divided by post impressions)
- Paid ads (click-throughs divided by ad impressions)
Low CTR despite good engagement might indicate a disconnection between your content and offers, unclear calls-to-action, or technical issues with your links. Conversely, high CTR with low on-site conversion could point to landing page issues or mismatched expectations.
Shopping Actions
For Shopify owners using Instagram Shopping features, track these critical in-platform shopping metrics:
- Product page views – How many users viewed your product details
- Product button clicks – Users who clicked to visit the product on your website
- Add to cart actions – Either on Instagram or after clicking through to your site
The ratios between these metrics reveal where potential customers drop off in your Instagram shopping funnel. For example, a high ratio of product views to button clicks might indicate issues with your Instagram product presentation, pricing, or offer.
Direct Conversion Metrics
Finally, we reach the ultimate goal—completed purchases. Track:
- Conversion rate – Percentage of Instagram visitors who complete a purchase
- Revenue attributed to Instagram – Total sales value from Instagram traffic
- Average order value (AOV) – Typical purchase amount from Instagram customers
- Products per order – Average number of items in Instagram-driven purchases
Compare these metrics against your overall store averages and other traffic sources. Instagram traffic often shows different purchasing patterns than search or email traffic, with its own strengths and weaknesses you can leverage.
Customer Value Metrics
These advanced metrics help you understand the long-term business impact of your Instagram marketing beyond immediate sales.
Customer Acquisition Cost (CAC)
How much are you spending to acquire each new customer through Instagram? Calculate CAC by dividing your total Instagram marketing costs (including content creation, management time, and ad spend) by the number of new customers acquired through the platform.
Compare Instagram CAC against other channels to determine its efficiency as an acquisition source. In 2025, many Shopify stores find that despite higher initial CAC, Instagram customers have higher lifetime value that justifies the acquisition expense.
Return on Ad Spend (ROAS)
For your paid Instagram campaigns, ROAS provides a direct efficiency metric. Calculate it by dividing revenue attributed to ads by your ad spend.
A ROAS of 2.0 means you’re generating $2 in revenue for every $1 spent on ads—generally considered the minimum threshold for profitable advertising. However, target ROAS varies based on your margins and business model.
Track ROAS by campaign type, ad format, targeting strategy, and creative approach to continuously refine your paid strategy. The most sophisticated Shopify stores create ROAS benchmarks for different campaign objectives, recognizing that awareness campaigns naturally produce lower immediate ROAS than retargeting efforts.
Customer Lifetime Value (CLV) from Instagram-Acquired Customers
Perhaps the most important yet overlooked metric is CLV—the total revenue a customer generates over their entire relationship with your business. Instagram-acquired customers often display different lifetime value patterns than those from other channels.
To calculate Instagram CLV:
- Identify cohorts of customers acquired through Instagram
- Track their purchasing behavior over time (6-12 months minimum)
- Calculate their average revenue contribution, purchase frequency, and retention rate
- Compare against customers acquired through other channels
Many Shopify stores discover that Instagram customers have higher repeat purchase rates and greater brand loyalty, which justifies higher acquisition costs and influences budget allocation decisions.
Advanced Analytics Strategies for Instagram-Shopify Integration
Once you’ve mastered the essential metrics, it’s time to explore advanced analytics strategies that will give you even deeper insights and a competitive edge.
Attribution Modeling for Instagram Traffic
Basic last-click attribution significantly undervalues Instagram’s contribution to your sales, especially given its strength in top-of-funnel brand discovery.
Multi-Touch Attribution Models
Various attribution models distribute conversion credit differently across touchpoints:
- First-click – Gives full credit to the first touchpoint, often overvaluing awareness channels like Instagram
- Last-click – Gives full credit to the final touchpoint, typically undervaluing Instagram’s contribution
- Linear – Distributes credit equally across all touchpoints
- Time-decay – Gives more credit to touchpoints closer to conversion
- Position-based – Attributes 40% to first touch, 40% to last touch, and 20% distributed among middle touches
No single model is perfect, but comparing results across models provides a more nuanced understanding of Instagram’s role in your sales process. Many successful Shopify stores create a custom attribution model weighted according to their specific customer journey.
Cross-Device Tracking Solutions
The reality of modern shopping is that customers frequently switch devices during their journey. They might discover products on Instagram mobile, research on desktop, and finally purchase on mobile again.
Meta’s Conversions API helps address this challenge by sending server-side events directly to Facebook/Instagram, improving tracking accuracy across devices. To implement it:
- Install a Conversions API app from the Shopify App Store or work with a developer to set up a custom integration
- Configure the API to send the same events as your pixel
- Use consistent user identifiers where possible (customer email, phone, etc.)
This approach significantly improves attribution accuracy in an increasingly privacy-focused digital landscape.
Incrementality Testing
The ultimate question is not what sales Instagram gets credit for, but what sales wouldn’t have happened without Instagram. This is where incrementality testing comes in.
A basic incrementality test structure:
- Identify two similar audience segments
- Expose one segment to your Instagram marketing while withholding it from the control group
- Measure the difference in conversion rates between the groups
- Calculate the incremental lift attributable to Instagram
More advanced approaches include geo-testing (varying Instagram activity by region) and holdout experiments (temporarily pausing Instagram for random user subsets). These tests provide the clearest picture of Instagram’s true business impact.
Segmentation and Cohort Analysis
Aggregate metrics hide valuable insights. Breaking down your data through segmentation and cohort analysis reveals patterns that can transform your Instagram strategy.
Audience Segmentation Strategies
Analyze Instagram performance across different audience segments:
- Demographic segments – How do conversion rates vary by age, gender, or location?
- Behavioral segments – Do users who engage with specific content types convert differently?
- Platform segments – How does performance differ between Android and iOS users?
This segmented view helps you identify your highest-value audience niches and tailor content accordingly. For instance, you might discover that fashion accessory content drives high engagement but low conversion with younger demographics, while product tutorials convert exceptionally well with an older audience.
Cohort Analysis Techniques
Cohort analysis groups users based on shared characteristics or experiences and tracks their behavior over time. For Instagram analytics, consider these cohort structures:
- Acquisition cohorts – Group customers by when they first discovered your brand on Instagram
- Campaign cohorts – Track users exposed to specific Instagram campaigns
- Engagement-level cohorts – Compare behavior of highly engaged Instagram followers versus passive followers
This temporal analysis reveals how your Instagram effectiveness evolves over time and helps identify successful strategies worth scaling or problems requiring attention.
Competitive Benchmarking
Your metrics exist in a competitive context. Tools like Rival IQ, Sprout Social, or even Instagram’s native competitors feature help you benchmark your performance against similar brands.
Key competitive metrics to benchmark include:
- Engagement rate relative to industry average
- Content frequency and timing patterns
- Follower growth rate comparison
- Content mix strategies (how competitors balance different post formats)
This competitive intelligence helps you identify industry best practices, content gaps you can fill, and performance expectations appropriate for your category.
Predictive Analytics and Forecasting
The most advanced Instagram analytics move beyond reporting what happened to predicting what will happen—and why.
Trend Analysis for Content Strategy
By analyzing historical performance data, you can identify patterns that inform future content creation:
- Seasonal trends in engagement and conversion
- Day-of-week and time-of-day performance patterns
- Content themes that consistently outperform others
- Visual elements that correlate with higher conversion (colors, composition, text usage)
These insights allow you to develop a data-backed content calendar that optimizes for both engagement and conversion based on proven performance patterns.
Sales Forecasting from Instagram Metrics
For many Shopify stores, Instagram engagement metrics serve as leading indicators for sales. By analyzing the relationship between specific Instagram metrics and subsequent sales figures, you can build predictive models.
For example, you might discover that:
- A 20% increase in story views typically leads to a 5% increase in sales the following week
- Surpassing 100 comments on a product post correlates with a 15% spike in that product’s sales
- Reaching 500 new followers in a week forecasts a 7% increase in monthly revenue
These correlations vary by business, but finding your specific patterns enables more accurate sales forecasting and proactive inventory management.
Budget Allocation Optimization
Predictive analytics can help optimize how you allocate resources across different Instagram marketing activities:
- Determining the optimal content mix between organic and paid efforts
- Predicting ROI for increased investment in specific content formats
- Forecasting the impact of influencer collaborations versus direct advertising
Advanced Shopify merchants use these predictions to develop dynamic budget allocation models, automatically shifting resources to the highest-performing tactics as performance data comes in.
Monetizing Instagram Engagement Through Shopify
Analytics are meaningless without action. In this section, we’ll explore how to translate Instagram insights into tactics that drive real revenue through your Shopify store.
Instagram Shopping Features Optimization
Instagram’s shopping features create a direct path from discovery to purchase. Optimizing these features based on analytics insights can significantly boost conversion rates.
Product Tagging Strategies
Analytics often reveal that simply adding product tags isn’t enough—strategic tagging makes a substantial difference:
- Optimal tag quantity – Data typically shows that 2-3 product tags per post achieve the highest click-through rates, while more tags can dilute attention
- Tag placement – Heat map analysis often reveals that tags placed centrally on the featured product get significantly more clicks than peripheral tags
- Tag timing – For videos and Reels, analytics frequently show that tags introduced after the first 3 seconds but before the halfway point perform best
By analyzing tag performance across your content, you can develop tagging best practices specific to your products and audience.
Instagram Shop Configuration
Your Instagram Shop tab serves as a curated storefront. Analytics can guide its optimization:
- Organize products into collections based on browsing patterns identified in your shop analytics
- Feature products that show high engagement-to-conversion ratios
- Regularly update featured items based on seasonal trends identified in your historical data
- Test different collection structures and measure their impact on browse-to-purchase conversion
The goal is to create a shop experience that matches how your Instagram audience naturally discovers and evaluates products.
Checkout Experience Optimization
The journey from Instagram to completed purchase should be as frictionless as possible. Analytics can identify friction points:
- Analyze where drop-offs occur in the purchase funnel
- Compare conversion rates between in-app checkout and website checkout
- Test different product page layouts for Instagram traffic and measure completion rates
- Optimize mobile checkout specifically for Instagram users, who are predominantly on mobile devices
A/B testing different checkout flows specifically for Instagram traffic often reveals surprising insights about what motivates your Instagram audience to complete purchases.
Content Strategy for Conversion
Not all engaging content drives sales. Use your analytics to develop a conversion-focused content strategy.
High-Converting Content Formats
Analysis typically reveals specific content types that drive disproportionate conversion:
- Product demonstrations – Particularly effective for complex or feature-rich products
- Before/after content – Consistently high-converting for transformational products
- User-generated content – Often drives higher trust and conversion than branded content
- Behind-the-scenes content – Builds emotional connection that translates to higher lifetime value
Your analytics will reveal which formats work specifically for your products and audience. Double down on these high-performers while testing new approaches.
Call-to-Action Optimization
The language, placement, and timing of your calls-to-action significantly impact conversion rates. A/B test different approaches and measure the results:
- Direct vs. indirect CTAs (“Shop now” vs. “See how it works”)
- Question-based vs. command-based CTAs (“Ready to transform your skin?” vs. “Transform your skin today”)
- FOMO-inducing vs. benefit-focused CTAs (“Limited time offer” vs. “Free shipping included”)
Your analytics will reveal patterns in which CTA styles resonate with your audience. These insights should inform not just your Instagram captions but your overall marketing language.
Content Calendar Planning for Sales Goals
A strategic content calendar aligns Instagram activity with your sales objectives:
- Schedule high-conversion content types before and during promotional periods
- Balance promotional content with value-building content based on the engagement-to-conversion ratios in your analytics
- Align content themes with seasonal buying patterns identified in your historical data
- Build in testing periods to experiment with new approaches before major sales events
This data-informed approach ensures your Instagram content drives business results rather than just vanity metrics.
Instagram Advertising for Shopify Sales
Paid advertising amplifies your organic strategy and provides even richer analytics data to inform your overall approach.
Ad Format Selection Based on Objectives
Different ad formats serve different purposes in your marketing funnel:
- Story ads – Analytics typically show these excel for awareness and consideration phases
- Feed ads – Often demonstrate better direct response performance for familiar products
- Reels ads – Data usually shows these provide the broadest reach but with less targeted intent
- Shopping ads – Conversion data generally indicates these perform best for retargeting and bottom-funnel objectives
Your ad analytics will reveal which formats perform best for each campaign objective, allowing you to allocate budget accordingly.
Targeting Strategies for Maximum ROI
Advanced targeting significantly improves advertising efficiency:
- Lookalike audiences – Create based on your highest-value customer segments identified through your analytics
- Custom audiences – Build retargeting segments based on specific engagement patterns that correlate with higher conversion
- Interest targeting – Refine based on performance data across different interest categories
Continuous analysis of targeting performance helps you progressively narrow your focus to the most profitable audience segments.
Budget Allocation and Bid Strategy
Optimization at the budget level drives overall campaign efficiency:
- Shift budget toward ad sets with the lowest customer acquisition costs
- Adjust bidding strategies based on conversion patterns identified in your analytics
- Implement day-parting based on hourly performance data
- Scale spending gradually on successful campaigns while monitoring performance thresholds
The most successful Shopify advertisers develop systematic processes for budget allocation decisions based on performance data rather than gut feeling.
Leveraging Instagram Analytics for Long-Term Growth
Beyond immediate sales, Instagram analytics can inform strategies for sustainable business growth and customer relationships.
Building an Instagram-to-Email Pipeline
Email remains the highest-ROI channel for most e-commerce businesses. Instagram can serve as a powerful email acquisition channel when properly optimized.
Email List Building Through Instagram
Analytics can guide your Instagram-to-email conversion strategy:
- Identify which content types drive the highest email signup rates
- Test different lead magnets and measure their conversion effectiveness
- Analyze the profile visit-to-signup ratio for different CTAs and landing pages
- Calculate the average value of an email subscriber acquired through Instagram
This data helps you determine how much you can afford to invest in Instagram-driven list building and which approaches generate the highest-quality subscribers.
Segmented Email Marketing Based on Instagram Behavior
Your Instagram analytics provide valuable insights for email personalization:
- Create email segments based on the Instagram content categories users engaged with
- Develop targeted email flows for users who discovered you through specific Instagram campaigns
- Personalize email content based on Instagram browsing patterns
This cross-platform personalization significantly improves email engagement and conversion metrics, as shown through comparative analysis of segmented versus generic campaigns.
Instagram-Email Synergy for Customer Retention
Analytics reveal opportunities for platform-reinforcing activities:
- Identify which email content drives the highest Instagram re-engagement
- Measure the impact of Instagram-exclusive offers promoted via email
- Track how cross-platform engagement affects customer lifetime value
The data often shows that customers engaged on both platforms have significantly higher retention rates and average order values—insights that should inform your cross-promotion strategy.
Influencer Marketing Measurement
Influencer collaborations can significantly expand your reach, but measuring their impact requires specialized analytics approaches.
Influencer Campaign Analytics
Comprehensive measurement approaches for influencer ROI include:
- Unique tracking links or promo codes for direct attribution
- Before/after analysis of engagement and conversion metrics
- Isolated testing of influencer content through paid amplification
- Brand lift studies to measure awareness impact
These measurement strategies help you identify which influencer partnerships deliver genuine business results versus those that generate engagement without conversion.
User-Generated Content Performance
UGC represents a valuable extension of your content strategy. Analytics help optimize its use:
- Compare engagement and conversion metrics for UGC versus branded content
- Identify which UGC creators and styles drive the highest performance
- Measure the impact of featuring UGC in different contexts (feed, stories, ads)
These insights inform both your content curation and your UGC acquisition strategies, helping you focus on the most effective content types.
Community Building Metrics
A strong community drives sustainable growth. Measure community health through:
- Repeat engagement rates (how often the same users engage with multiple posts)
- User-to-user interaction metrics (comments and mentions between community members)
- Brand defense indicators (community response to negative comments or competitive challenges)
These community vitality metrics often correlate with higher retention rates and customer lifetime value, justifying investment in community-building activities.
Continuous Optimization Framework
The most successful Shopify stores implement systematic processes for turning analytics insights into action.
Regular Analytics Review Process
Establish a structured approach to analytics review:
- Daily checks – Quick performance scans for active campaigns and recent content
- Weekly analysis – Deeper review of content performance and campaign metrics
- Monthly reporting – Comprehensive performance assessment against goals
- Quarterly strategy reviews – In-depth analysis of trends and strategic direction
Each review level should have defined metrics, benchmarks, and action triggers to ensure insights translate to improvements.
A/B Testing Methodology
Implement a disciplined testing approach:
- Maintain a testing calendar with clear hypotheses for each test
- Ensure adequate sample sizes for statistical significance
- Test only one variable at a time for clean results
- Document and share learnings systematically
This methodical approach turns Instagram from a creative guessing game into a continuously improving, data-driven marketing channel.
Agile Marketing Adaptation
Analytics should inform rapid tactical adjustments:
- Set performance thresholds that trigger automatic strategy shifts
- Establish processes for quickly scaling successful content approaches
- Create contingency plans for underperforming campaigns
- Develop frameworks for testing and implementing new Instagram features
This agility allows you to capitalize on opportunities and address issues faster than competitors, creating cumulative advantages over time.
Future Trends in Instagram Analytics for Shopify Owners
The analytics landscape continues to evolve. Understanding emerging trends helps you stay ahead of the curve.
Emerging Technologies and Features
Several technological developments are reshaping Instagram analytics possibilities.
AI and Machine Learning Applications
Artificial intelligence is transforming how merchants analyze Instagram performance:
- Predictive content performance tools that forecast engagement before posting
- Automated creative optimization that identifies and adapts winning elements
- Advanced customer segmentation that identifies behavior patterns humans might miss
- Intelligent budget allocation that continuously redistributes spend to highest-performing tactics
These AI capabilities are becoming increasingly accessible to Shopify merchants through integrated apps and platforms.
Augmented Reality Shopping Experiences
AR features create new analytics dimensions to measure:
- Virtual try-on engagement and conversion impact
- AR filter sharing and viral coefficient
- Dwell time in AR experiences versus traditional content
- Conversion rate differences between AR-engaged and non-AR customers
Early adopters of AR shopping features gain both competitive advantage and valuable data on how these experiences influence purchasing decisions.
New Instagram Features and Their Analytics Implications
Instagram regularly introduces new features that require analytics adaptation:
- Understanding how to measure performance on collaborative posts
- Developing frameworks for analytics on new ad formats
- Adapting attribution models to account for new shopping features
Staying current with platform changes and quickly implementing measurement approaches for new features allows you to capitalize on opportunities before competitors.
Privacy Changes and Their Impact
The analytics landscape is being reshaped by privacy regulations and platform changes.
Adapting to Cookie Deprecation
As third-party cookies disappear, alternative measurement approaches are essential:
- Server-side tracking implementation through Meta’s Conversions API
- First-party data collection strategies via owned channels
- Probabilistic matching techniques that connect user touchpoints without direct tracking
- Increased reliance on platform-provided attribution data
These approaches preserve measurement capabilities while respecting user privacy preferences and technical limitations.
Compliance with Evolving Regulations
Global privacy regulations continue to evolve, requiring adaptive analytics strategies:
- Ensuring consent management systems capture and respect user preferences
- Implementing data minimization and purpose limitation principles
- Adapting measurement approaches to comply with regional requirements
Treating privacy as a competitive advantage rather than an obstacle allows you to build customer trust while maintaining effective measurement.
Identity Resolution in a Privacy-Centric Environment
As individual user tracking becomes more limited, alternative approaches emerge:
- Cohort-based analysis that maintains privacy while revealing patterns
- Enhanced contextual understanding that derives insights without personal data
- First-party identity graphs that connect touchpoints within owned environments
These approaches represent the future of ethical, effective analytics in a privacy-focused digital ecosystem.
Strategic Preparation for Future Changes
Forward-thinking Shopify merchants are already preparing for the evolving landscape.
Building First-Party Data Assets
First-party data becomes increasingly valuable as third-party data diminishes:
- Creating compelling value exchanges for customer data sharing
- Implementing progressive profiling to build comprehensive customer understanding
- Developing infrastructure to securely store and activate customer data
This owned data foundation provides measurement resilience against platform changes and privacy restrictions.
Diversification of Marketing Channels
Over-reliance on Instagram creates vulnerability. Analytics should inform diversification:
- Measuring channel interaction effects to understand the complete ecosystem
- Identifying complementary channels that reach similar high-value audiences
- Developing cross-channel attribution models that capture full customer journeys
A diversified, data-connected marketing approach provides both growth opportunities and risk mitigation.
Investing in Analytics Capabilities
Analytics excellence requires ongoing investment:
- Team training on emerging measurement methodologies
- Technology infrastructure that adapts to changing requirements
- Process development for turning insights into action
- Cultural emphasis on data-driven decision making
These investments create compounding returns as the complexity of the marketing landscape increases, giving analytics-mature organizations a growing advantage.
References
- Meta for Business. (2024). “Facebook & Instagram by Meta: Official Shopify Integration Guide.” Retrieved from https://www.facebook.com/business/instagram/shopping/guide
- Klaviyo. (2025). “Instagram to Email Marketing: Revenue Benchmarks for Shopify Stores.” Retrieved from https://www.klaviyo.com/blog/instagram-email-marketing-benchmarks
- Shopify. (2024). “Instagram Shopping Integration: Official Documentation.” Retrieved from https://help.shopify.com/en/manual/promoting-marketing/create-marketing/instagram-shopping
- Hyros. (2023). “How to Measure the True ROI of Your Instagram Ads.” Retrieved from https://hyros.com/updates/how-to-measure-the-true-roi-of-your-instagram-ads/
- Popsmash. (2025). “How to estimate Shopify sales growth from Instagram (3 yrs of data).” Retrieved from https://www.popsmash.com/blog/how-shopify-stores-can-calculate-the-value-of-their-instagram-audience-in-new-sales
Ready to supercharge your Shopify store’s sales with perfectly optimized discount codes? Growth Suite is a Shopify app that helps you boost conversions using AI-driven campaign tools. With real-time limited offers and personalized discounts, you can dramatically increase your conversion rates while protecting your brand. Growth Suite creates excitement through countdown timers and automatically applies unique discount codes for each visitor—no copy/paste needed! Install it with a single click and start seeing results with the free 14-day trial. Join the thousands of merchants who’ve already transformed their sales with Growth Suite!