Ever wondered why some Shopify stores consistently outperform their competition? The secret isn’t just stunning product photos or clever marketing campaigns—it’s the obsessive tracking of the right metrics. As a store owner, you’re swimming in data. But are you measuring what truly matters?
The difference between thriving Shopify stores and those that merely survive often comes down to how they collect, interpret, and act on their conversion metrics. These numbers tell the story of your business—where you’re excelling and where you’re leaving money on the table.
In this guide, we’ll walk through the essential conversion metrics that can transform your Shopify store from guesswork to growth machine. You’ll learn which numbers deserve your attention, how to interpret them correctly, and most importantly, how to turn these insights into action. Whether you’re just starting out or looking to scale your existing operation, mastering these metrics will give you the clarity to make confident, revenue-generating decisions.
The Critical Role of Conversion Metrics in Shopify Store Performance
Your Shopify store generates valuable data with every visitor click, product view, and checkout completion. This digital footprint offers insights that even the most experienced merchant couldn’t intuit on their own. But why exactly should you care about conversion metrics?
Simply put, conversion metrics bridge the gap between traffic and revenue. You might be attracting thousands of visitors to your store, but if they’re not converting into customers, you’re essentially hosting an online window shopping experience. Not exactly the business model you had in mind, right?
Conversion metrics illuminate the path your customers take—from landing on your site to completing a purchase. They highlight where people get stuck, lose interest, or decide to buy. This visibility allows you to make targeted improvements rather than random changes based on hunches or what your competitors are doing.
For instance, discovering that your mobile checkout completion rate is 40% lower than desktop gives you a clear improvement opportunity. Without tracking this metric, you might never identify this revenue leak. These data points become your compass, guiding your optimization efforts where they’ll have the greatest impact.
Setting Realistic Benchmarks for Your Shopify Store
Before diving into individual metrics, let’s address a common pitfall: comparing your store to irrelevant benchmarks. The truth is, conversion rates vary dramatically across industries, price points, and product types.
A luxury furniture store with a $1,200 average order value will naturally have a lower conversion rate than a t-shirt store with a $30 price point. This doesn’t mean the furniture store is underperforming—the higher ticket value compensates for fewer conversions.
Start by researching standard conversion rates within your specific niche. Industry reports from sources like Littledata, which specializes in Shopify analytics, can provide relevant benchmarks. For example, they report that the average Shopify store converts at around 1.4-3%, but food and beverage stores often see rates closer to 4%.
Once you have industry standards in mind, establish your own baseline by tracking your metrics for several weeks. This becomes your starting point—your goal is to improve upon your own numbers rather than chasing potentially unrealistic industry averages.
Remember, even small improvements in conversion metrics can yield significant revenue gains. A 0.2% increase in conversion rate might not sound impressive, but it could translate to thousands in additional monthly revenue.
Core Conversion Rate Metrics
Overall Store Conversion Rate
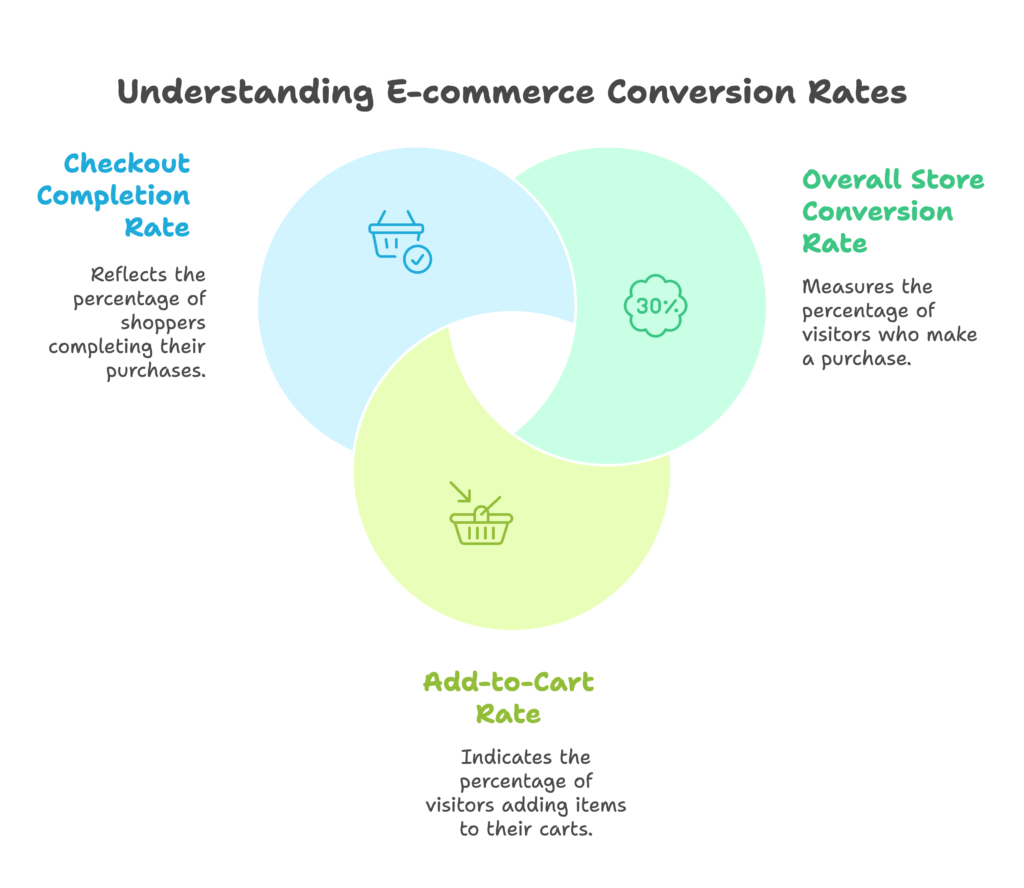
Your store’s overall conversion rate is the North Star metric that indicates your site’s effectiveness at turning visitors into customers. At its simplest, it’s calculated by dividing your total number of orders by your total visitors, then multiplying by 100 to get a percentage.
For example, if your Shopify store had 10,000 visitors last month and 250 of them made a purchase, your conversion rate would be 2.5% (250 ÷ 10,000 × 100 = 2.5%).
Finding this data in Shopify is straightforward. Navigate to your Shopify Analytics dashboard and look for the “Online store conversion rate” metric. Shopify calculates this automatically, saving you the manual computation.
But what constitutes a “good” conversion rate? While the average across all Shopify stores hovers between 1.4% and 3%, this number varies significantly by industry. Beauty products typically convert higher than electronics. Seasonal items convert differently during peak versus off-peak periods.
Rather than obsessing over hitting an arbitrary number, focus on consistent improvement. Track your conversion rate over time, noting how it responds to changes you make on your store. Did that new product page template boost conversions? Did the simplified checkout process move the needle? These insights are where the real value lies.
Sales Funnel Conversion Metrics
While overall conversion rate offers a bird’s-eye view, drilling down into your sales funnel metrics reveals exactly where potential customers drop off. This granular view helps you identify and fix specific friction points.
The add-to-cart rate measures what percentage of your visitors place items in their cart. According to Littledata, the average Shopify store has an add-to-cart rate of around 5.1%. If your rate is significantly lower, it might indicate issues with product presentation, pricing clarity, or the user experience of your product pages.
To track this in Shopify, go to Analytics > Reports > Behavior > Add to cart rate. Pay attention to how this rate varies across products. You might discover that certain items suffer from poor imagery, unclear descriptions, or pricing concerns that prevent visitors from taking that crucial first step toward purchase.
The checkout completion rate reveals what percentage of shoppers who begin checkout actually complete their purchase. This metric often uncovers issues in your checkout flow. Is your shipping cost causing sticker shock? Is your checkout process too lengthy or confusing? Are you offering the payment methods your customers prefer?
A low checkout completion rate (high cart abandonment) represents a massive opportunity. These customers have shown high intent—they’ve selected products and started to pay. They’re much easier to convert than cold traffic.
Shopify offers powerful tools to improve this metric, like Shop Pay, which can increase conversion rates by up to 50% by offering a faster checkout experience. Enabling relevant payment options (from PayPal to Buy Now, Pay Later services) can also dramatically improve your completion rate by removing barriers at the critical moment of decision.
Customer Value Metrics
Average Order Value (AOV)
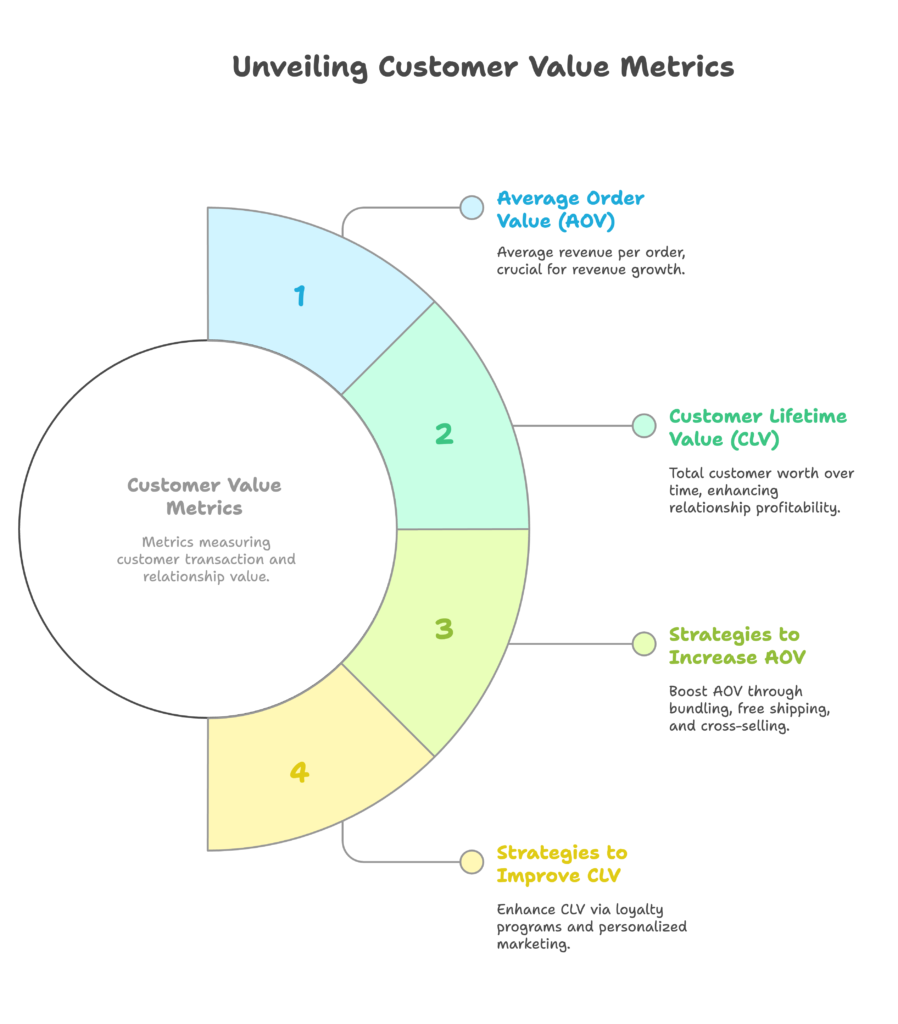
While conversion rate tells you what percentage of visitors buy, average order value (AOV) tells you how much they’re spending when they do. Increasing your AOV is often easier than increasing your conversion rate, making it one of the most effective levers for growing revenue.
Calculate your AOV by dividing your total revenue by the number of orders. For example, if your store generated $50,000 from 1,000 orders last month, your AOV would be $50.
In Shopify, you can find this metric by going to Analytics > Dashboard, where it’s displayed prominently. You can also analyze how your AOV changes over time and across different customer segments or traffic sources.
Several strategies can help boost your AOV. Product bundling encourages customers to purchase complementary items together at a slight discount. For instance, a skincare brand might bundle cleanser, toner, and moisturizer in a “complete routine” set.
Offering free shipping above a certain threshold is another powerful tactic. If your AOV is $45, consider offering free shipping on orders over $60. You’ll be surprised how many customers will add items to qualify, often spending well above the minimum threshold.
Cross-selling related products on the product page and in the cart can also nudge customers toward additional purchases. “Frequently bought together” or “You might also like” sections leverage your existing traffic to increase order values without requiring additional marketing spend.
Customer Lifetime Value (CLV)
While AOV measures the value of a single transaction, customer lifetime value (CLV) reveals the total worth of a customer relationship over time. This metric shifts your focus from one-time sales to building lasting customer relationships—often a more profitable approach.
The basic formula for CLV is: Average Order Value × Average Number of Purchases × Average Customer Lifespan. For example, if your average customer spends $50 per order, makes 2.5 purchases per year, and remains a customer for 2 years, their CLV would be $50 × 2.5 × 2 = $250.
Shopify provides tools to analyze customer behavior over time through its cohort analysis feature. Go to Analytics > Reports > Customers > Customer cohort analysis to see how different customer groups behave over time.
Understanding CLV changes how you view customer acquisition costs. If you know a customer is worth $250 over their lifetime, spending $50 to acquire them becomes a clear investment rather than an expense.
CLV also helps identify your most valuable customer segments. You might discover that customers who first purchase a specific product category have a 30% higher lifetime value than average. This insight could reshape your marketing strategy, focusing more resources on acquiring these high-value customers.
To improve CLV, focus on encouraging repeat purchases through loyalty programs, personalized email marketing, and exceptional customer service. Remember, retaining existing customers typically costs 5-25% of what you’d spend acquiring new ones, making CLV improvement one of the most cost-effective growth strategies.
Traffic and Engagement Metrics
Traffic Sources and Channel Performance
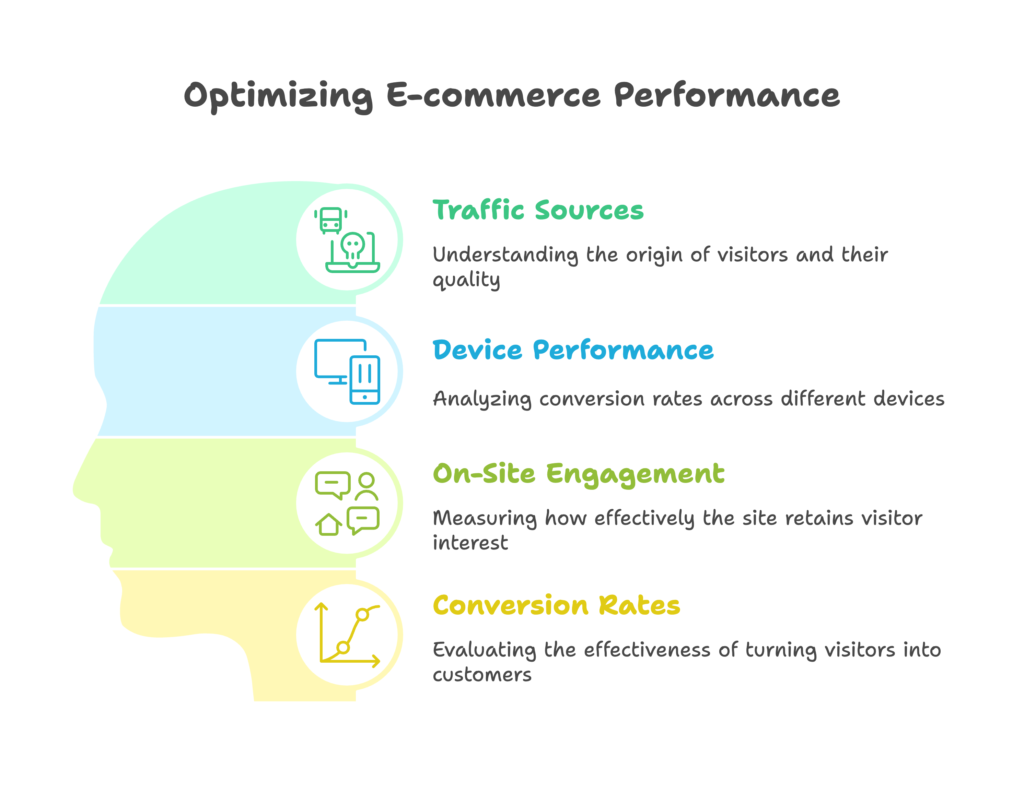
Not all traffic is created equal. Some channels might send you thousands of visitors who rarely purchase, while others deliver fewer but more qualified prospects. Understanding where your best customers come from helps you allocate your marketing budget more effectively.
To analyze traffic by source in Shopify, navigate to Analytics > Reports > Sales by channel. This report breaks down your sales and conversion rates across different traffic sources, including direct traffic, search engines, social media, and email campaigns.
Pay attention to both the volume of traffic and the conversion rate from each source. You might discover that your Instagram followers convert at twice the rate of your Facebook traffic, suggesting you should double down on Instagram marketing. Or perhaps your email campaigns drive the highest converting traffic, indicating you should invest more in growing your subscriber list.
Device-specific performance metrics provide another crucial perspective. With mobile shopping continuing to grow, comparing conversion rates across desktop, mobile, and tablet users can reveal significant optimization opportunities.
In Shopify, go to Analytics > Reports > Sessions by device to see how different devices perform. If your mobile conversion rate lags significantly behind desktop (a common issue), you may need to improve your mobile shopping experience.
Solutions might include switching to a more responsive Shopify theme, simplifying your mobile navigation, or ensuring product images load quickly on cellular connections. Small improvements to mobile usability often yield outsized conversion gains as more shoppers shift to smartphone shopping.
On-Site Engagement Metrics
Once visitors arrive at your store, engagement metrics tell you how effectively you’re capturing and maintaining their interest. Two key metrics to watch are bounce rate and session duration.
Bounce rate measures the percentage of visitors who leave your site after viewing only one page. A high bounce rate often indicates that visitors aren’t finding what they expected or that your site fails to engage them effectively.
Session duration shows how much time visitors spend browsing your store. Longer sessions typically correlate with higher engagement and purchase intent, though this varies by product type. Complex or high-consideration purchases naturally lead to longer browsing sessions.
To access these metrics, you’ll want to connect Google Analytics to your Shopify store, as it provides more detailed engagement data than Shopify’s native analytics. In Google Analytics, navigate to Behavior > Site Content > All Pages to see engagement metrics for each page on your site.
Page-specific conversion rates help you identify which parts of your site are performing well and which need improvement. You might discover that visitors who view your “About Us” page convert at a higher rate than those who don’t—suggesting that building trust is crucial for your particular audience.
A/B testing different page elements can help you systematically improve engagement. Try testing different product page layouts, headline variations, or call-to-action buttons. Several Shopify apps facilitate A/B testing without requiring technical expertise.
Remember that improvements to engagement metrics often have a compound effect on conversions. A 20% decrease in bounce rate might lead to a 15% increase in add-to-cart rate, which could ultimately lift your overall conversion rate significantly.
Cart and Checkout Optimization Metrics
Cart Abandonment Rate
Picture this: a customer browses your store, selects items, adds them to their cart, begins the checkout process… and then disappears. This all-too-common scenario is measured by your cart abandonment rate, and it represents one of the most significant revenue opportunities for most Shopify stores.
The average cart abandonment rate across e-commerce hovers around 70%, meaning for every 10 shoppers who add products to their cart, 7 leave without completing their purchase. While some abandonment is inevitable, reducing this rate even slightly can dramatically increase your revenue without requiring additional traffic.
Shopify makes it easy to track abandoned checkouts. Go to Analytics > Reports > Abandoned checkouts to see how many potential sales you’re losing and their total value. This report also shows customer information for abandoned carts, enabling targeted recovery efforts.
The most effective recovery strategy is abandoned cart emails. Shopify allows you to automatically send reminder emails to customers who provided their contact information before abandoning. A sequence of 2-3 well-crafted emails can recover 10-15% of abandoned carts.
For maximum effectiveness, consider:
- Sending the first recovery email within 1-2 hours of abandonment
- Including images of the abandoned items to trigger recall
- Offering a small incentive like free shipping or a 10% discount to overcome hesitation
- Adding a sense of urgency with limited-time offers or low stock notifications
Exit-intent popups provide another recovery opportunity by engaging shoppers who show signs of leaving during checkout. A timely offer or reassurance about shipping, returns, or payment security can recapture wavering customers before they bounce.
Checkout Funnel Analysis
The checkout process typically consists of multiple steps, and customers can drop off at any point. Checkout funnel analysis breaks down this journey to identify exactly where friction occurs.
A typical Shopify checkout funnel includes:
- Cart review
- Customer information collection
- Shipping method selection
- Payment information entry
- Order review and confirmation
To analyze your checkout funnel in Shopify, go to Analytics > Reports > Behavior > Checkout process. This report shows the conversion rate between each step, helping you identify trouble spots.
For example, you might discover a significant drop-off between shipping selection and payment, suggesting that shipping costs are surprising or disappointing your customers. Or perhaps many customers abandon during the information entry stage, indicating that your form might be too complex or time-consuming.
Once you’ve identified drop-off points, you can implement targeted solutions. If shipping cost causes abandonment, consider building shipping into your product prices and offering “free shipping.” If information entry is the problem, enable accelerated checkout options like Shop Pay, which Shopify reports can increase conversion by up to 50% by reducing form fields and saving customer information.
Other checkout optimization strategies include:
- Offering multiple payment options, including popular digital wallets and Buy Now, Pay Later services
- Displaying trust badges and security reassurances near payment fields
- Simplifying the checkout page by removing distractions and unnecessary fields
- Making shipping policies and return information clearly visible during checkout
Even small improvements to your checkout process can yield significant conversion gains. A 5% increase in checkout completion rate can translate to thousands in additional monthly revenue for an established store.
Product Performance Metrics
Product-Specific Conversion Rates
While your overall store conversion rate provides a broad health indicator, product-specific conversion rates reveal which items are stars and which are underperformers. This granular view helps you optimize your catalog, merchandising, and marketing efforts.
To access product performance data in Shopify, go to Analytics > Reports > Product > Product sales report. This shows sales volume for each product, but to calculate product-specific conversion rates, you’ll need to compare sales against product page views.
For a more detailed analysis, use the “Sales by product” report combined with the “Online store conversion by product” report. This helps you identify interesting patterns—products with high page views but low conversions may have issues with presentation, price, or product-market fit.
Once you’ve identified underperforming products, consider these improvement strategies:
- Enhance product images with more angles, lifestyle photos, or videos showing the product in use
- Rewrite product descriptions to address common questions and objections
- Add user-generated content like customer photos or reviews to build confidence
- Test different price points or discount strategies if price sensitivity seems to be an issue
- Improve the display of key features and benefits above the fold
The best-performing products offer valuable insights too. Analyze what makes your top converters successful—is it the photography style, the product description format, the way you present variations, or something else? Apply these winning elements across your other product pages.
Product recommendations and cross-selling can leverage your high-converting products to boost overall store performance. Featuring your star products prominently or using them as entry points for new customers can improve your store-wide conversion rate.
Inventory and Sales Metrics
Inventory management directly impacts your conversion potential. Out-of-stock products frustrate customers and waste marketing spend, while excess inventory ties up capital and can lead to profit-killing discounts.
Key inventory metrics to track include:
- Inventory turnover rate (how quickly you sell through inventory)
- Days of inventory on hand (average time inventory remains in stock)
- Sell-through rate (percentage of inventory sold within a specific period)
Shopify provides inventory reports under Analytics > Reports > Inventory > Low stock and Inventory history. Use these to identify seasonal patterns and inform your purchasing decisions.
For example, you might notice that certain products sell rapidly during specific seasons or after particular marketing activities. This insight helps you time inventory purchases to maintain optimal stock levels without overcommitting capital.
Return rate analysis provides another critical perspective on product performance. High return rates directly impact profitability and may indicate issues with product quality, sizing accuracy, or expectation setting in your marketing.
While basic return tracking requires manual record-keeping in standard Shopify, several Shopify apps offer comprehensive return management and analytics. Look for patterns in return reasons—if many customers return a product citing “not as described,” you may need to improve your product presentation.
Reducing return rates starts with setting accurate expectations. Detailed sizing information, accurate color representation in photos, and honest product descriptions prevent disappointment. Some merchants find that video demonstrations or 360° product views significantly reduce returns by giving customers a more complete understanding of what they’re purchasing.
Continuous Optimization Strategy
Implementing a CRO Testing Framework
The most successful Shopify stores approach conversion rate optimization (CRO) systematically rather than making random changes based on hunches. A structured testing framework helps you prioritize efforts and measure results accurately.
Start by creating a prioritized list of testing opportunities based on potential impact and implementation difficulty. The ideal candidates are high-impact, low-effort changes. For example, testing a new call-to-action button color might take minimal effort but could significantly impact conversion if your current button lacks visibility.
Use this simple framework to score potential tests:
- Potential Impact (1-10): How much could this change improve conversion?
- Implementation Ease (1-10): How easily can you implement and test this change?
- Current Evidence (1-10): How much data suggests this will help?
Multiply these scores to prioritize your testing roadmap. The highest-scoring opportunities should be tested first.
A/B testing allows you to compare two versions of a page or element to determine which performs better. Several Shopify apps facilitate A/B testing, including Google Optimize (free) and paid options like Dynamic Yield or Optimizely.
When running tests, follow these best practices:
- Test one element at a time to know exactly what caused any change in performance
- Ensure you have sufficient traffic for statistical significance (smaller stores may need to run tests longer)
- Set clear success metrics before starting the test
- Run tests for at least 1-2 weeks to account for day-of-week variations
- Avoid making other changes during the testing period
Once a test concludes, implement winning variations using Shopify’s theme editor or app settings. Document your results, including what was tested, the outcome, and lessons learned. This knowledge bank becomes invaluable as you continue optimizing your store.
Creating a Metrics Dashboard for Ongoing Monitoring
With so many metrics to track, creating a custom dashboard helps you maintain visibility without spending hours digging through reports. Your dashboard should focus on the metrics most relevant to your current business goals.
Shopify’s standard analytics provides a basic dashboard, but you can create more customized views using the reports feature or third-party tools. Consider organizing your dashboard into sections:
- Conversion overview (store-wide conversion rate, sales funnel metrics)
- Customer metrics (AOV, CLV, repeat purchase rate)
- Traffic and engagement (traffic by source, bounce rate)
- Cart and checkout (abandonment rate, checkout completion)
- Product performance (top and bottom performers)
For more advanced analytics, consider connecting your Shopify store to tools like Google Analytics 4, Glew.io, or Lifetimely. These platforms offer deeper insights and more customization options than Shopify’s native analytics.
Establish a regular review process for your metrics. A weekly quick check keeps you informed of immediate issues, while a monthly deep dive helps identify longer-term trends and opportunities. During these reviews:
- Compare current performance against previous periods
- Look for significant changes that require investigation
- Identify the highest-impact opportunities for improvement
- Create specific action plans with timelines and ownership
Remember that metrics are means to an end, not the end themselves. The goal isn’t perfect numbers but the insights and actions those numbers inspire. A systematic approach to measurement and optimization creates a virtuous cycle of improvement that compounds over time, driving sustained growth for your Shopify store.
References
- Shopify Blog. (2024, January 2). 20 Key Ecommerce Metrics To Track In 2024. https://www.shopify.com/blog/basic-ecommerce-metrics
- Omnisend. (2025, February 11). Shopify conversion rate optimization: 10 proven tactics. https://www.omnisend.com/blog/shopify-conversion-rate-optimization/
- Scale Shopify. (2025, January 4). How To Track Shopify Store Performance Metrics. https://scaleshopify.com/2025/01/04/how-to-track-shopify-store-performance-metrics/
- Two Minute Reports. (2025, March 7). 13 Key Shopify Metrics Every Ecommerce Marketer Should Track. https://twominutereports.com/blog/key-shopify-metrics
- First Pier. (2023, August 15). Top 10 Essential Shopify KPIs for E-commerce Success. https://www.firstpier.com/resources/top-ten-shopify-kpis
Ready to supercharge your Shopify store’s conversion rates with perfectly optimized discount campaigns? Growth Suite is a free Shopify app that helps you run effective on-site discount campaigns and email collection initiatives. Its powerful data engine analyzes visitor behavior to deliver personalized offers at the perfect moment, significantly boosting your conversion metrics. Install Growth Suite with a single click today and start turning more browsers into buyers!
Also don’t forget to check these articles to learn more about conversion rate optimization.
CRO Fundamentals for Shopify
Conversion Rate Optimization for Shopify Stores




[…] Key Conversion Metrics Every Shopify Store Owner Should Track […]
[…] Key Conversion Metrics Every Shopify Store Owner Should Track […]